How Sweat Sensors Work

Sweat Sensors

With many advantages compared to other bodily fluids, including urine and blood, sweat is being increasingly utilized for detecting analytes. Compared to other bodily fluids, collection of sweat is notably non-invasive and readily available which allows for increased detection accuracy with continuous measurement and preservation of analytes. The patent discussed in this post covers a fluid sensing device with the ability to collect a fluid sample and further concentrate the sample with respect to a target analyte. The device can then measure specific concentrations and detect changes in molarity to accurately correlate this data to physiological conditions. [1]

The main claim of this patent regards the concentrating component of the device. Other claims within this patent include a collector reservoir as well as a transport channel connecting the reservoir to the concentrating component. Several mechanisms are proposed to concentrate the fluid, including a pump to draw the fluid through a selective membrane as well as a density gradient with pores (Figure 1,2).This device also has the ability to induce sweat generation with an iontophoresis electrode. Within the device, an osmolarity sensor measures molarity of the collected fluid while a flow rate sensor measures sweat rate. The concentration of specific analytes are measured by sensors specific for those analytes. [1]

Who Uses It?

Sweat sensors were originally used to aid in detection and diagnosis of diseases, including cystic fibrosis and hyperparathyroidism, and became useful for drug monitoring and treatment. [2] These sensors are extremely useful in athletics to measure water loss and can indicate performance by analyte concentration. Sodium and chloride ion analytes can determine hydration status and monitor fluid loss during and after exercise. Hypohydration, in which the sweat rate is greater than water intake, induces antidiuretic hormone release to retain water, often resulting in decreased cardiac output, increased body temperature with reduced sweating, and decreased aerobic performance with increased glycogen breakdown to increase water availability. [3] Other electrolytes such a potassium ions can be measured to indicate muscle cramping or cardiovascular irregularities. Metabolites can also be measured, including lactate and glucose, to measure energy reserves and assess performance or fatigue.

Understanding How It Works

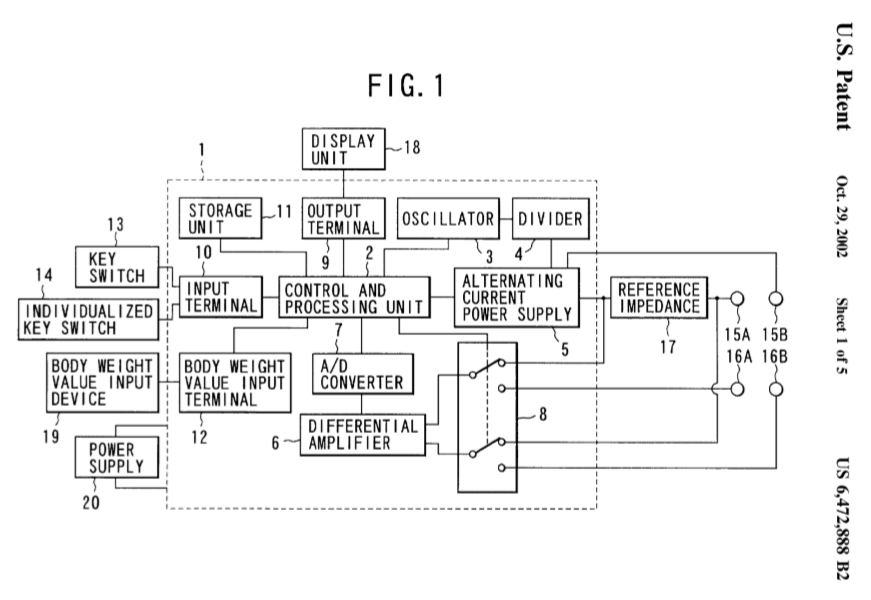
This invention proposes several mechanisms to concentrate a particular analyte in a biofluid such as sweat. The main mechanism uses a selective membrane in which the analyte sensor is surrounded by an immiscible material (Figure 1). For example, if the material is hydrophobic, only hydrophobic solutes in sweat could passively diffuse into the material, thus increasing the concentration of these selective solutes. This patent also includes the incorporation of a gradient in density or pore size corresponding to the direction of flow (Figure 2). In this case, the pore size corresponds to the size of the target analyte. As the pore sizes decrease, the analyte will become concentrated.

Figure 1. Sweat sensor with a selective membrane (655) within the microfluidic channel (680). The analyte sensor (620) contacts the concentrated target analyte. [1]

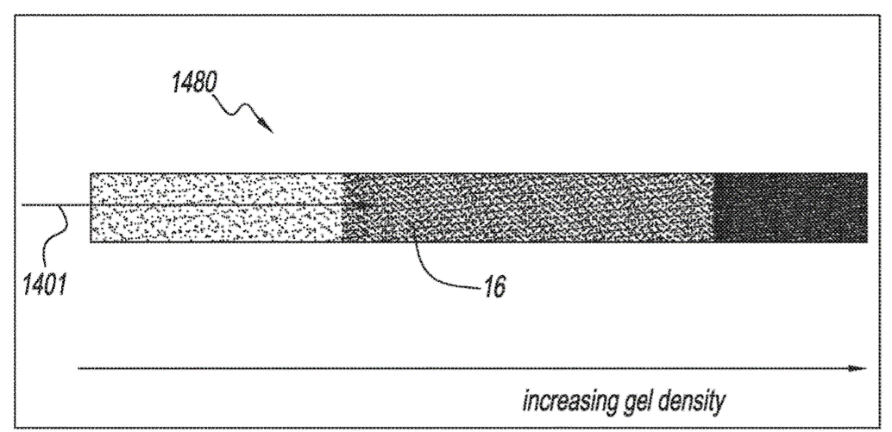
Figure 2. Illustration of increasing density in the direction of fluid flow (1401) to concentrate the fluid with respect to target analytes. [1] 

The distribution coefficient of the target analyte can be experimentally measured. As the target analyte molarity is equivalent to this coefficient, the concentration of the target analyte can be determined. [1] To determine the rate at which this analyte is leaving the body through sweat, including accounting for evaporation. The following equation can determine the diffusion coefficient [4]:

D=2PL/K, where

 D= diffusion coefficient
P = solute permeability of membrane
L= thickness of membrane
K= distribution or partition coefficient

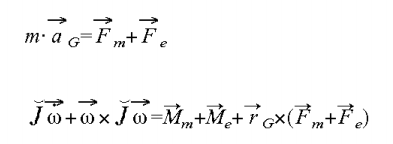
Knowing the diffusion coefficient is helpful to then determine the rate at which the target analyte is leaving the body through diffusion, accounting for factors like evaporation, by using Fick’s First Law [5]:

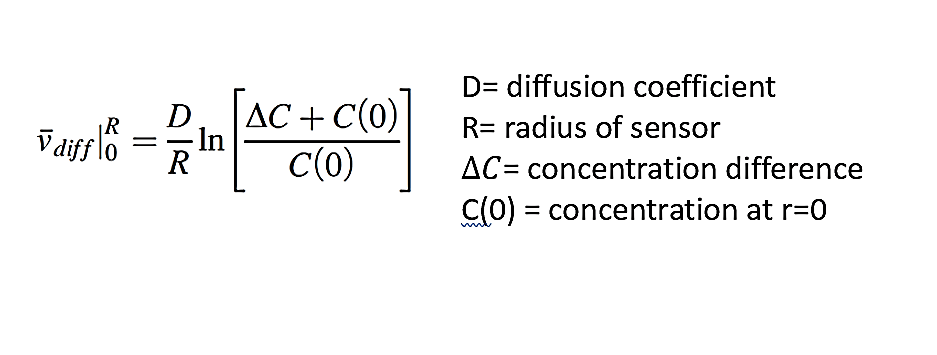
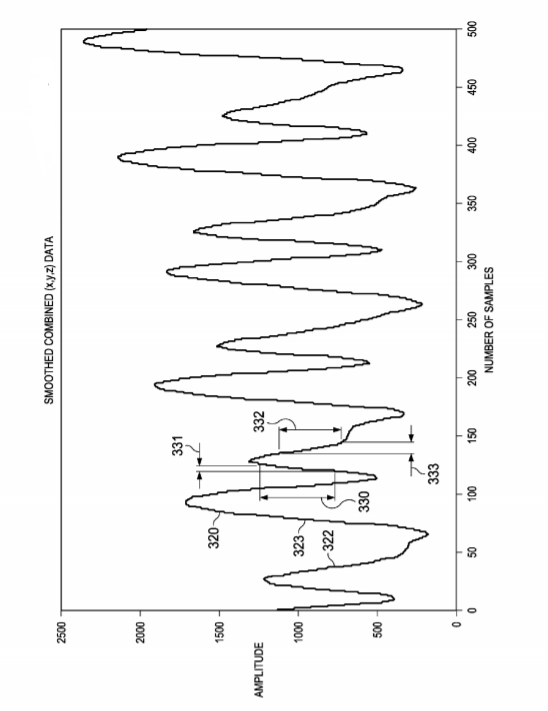
To determine the molarity of specific analytes, reference analytes can be used to ensure the sensors are able to accurately detect the target analyte (Figure 3).  The concentration of analytes unaffected by sweat rate, like K+, can be measured to indicate when a sufficient concentration of the target analyte can be measured.

Figure 3. Analyte measurements. Analytes with consistent concentration can be used as a reference to indicate changes in the concentration of another analyte. This ensures the concentration of the target analyte is sufficient enough for the sensor to accurately detect. In window 1, changes in potassium ion concentration are used as a reference for changes in BNP. Window 2 illustrates using changes in albumin, since it’s concentration is consistent, to indicate changes in BNP. [1]

Unique Features

While other inventions have focused on sweat collection methods, including removable absorbent pads to collect sweat (patent US4190060A), this device is the first to utilize concentration techniques to increase accuracy of detection. Other sweat sensors use similar osmolarity techniques to direct sweat from the skin into the sensor (patent US4756314A), but don’t utilize this method within the sensor for analysis.

This device attempts to improve limitations of previous sweat sensors by increasing accuracy of detection for analytes, even when they are diluted. For example, blood glucose is approximately 100 times more dilute in sweat than in blood, so concentrating this analyte can increase ability for detection. [6] With future developments in transport kinetics and understanding lag times of analyte diffusion in sweat, sweat sensors may continue to pioneer the way for detection of analytes in biofluids. [7]

Specific Patent Information

  1. Patent Title: Devices Capable of Fluid Sample Concentration for Extended Sensing of Analytes
  2. Patent Number: US 10,506,968 B2
  3. Patent Filing Date: April 30, 2018
  4. Patent Issue Date: December 17, 2019
  5. Time to Issue: 1 year 7 months 17 days
  6. Inventor(s): Jason Heikenfeld, Jacob Bertrand, Michael Brothers, Andrew Jajack
  7. Assignee: Eccrine Systems, Inc; University of Cincinatti
  8. U.S. Classification: A61B5/4266; A61B10/0012; A61B10/0064; A61B5/0004; A61B5/14517; A61B5/14521; A61B5/14532; A61B5/14546; A61B5/1468; A61B5/6833; A61F13/0246; G01N33/50; G01N33/5308; G01N33/5438; G01N33/66; A61B2010/0016; A61B5/0002
  9. Number of Claims: 10 claims

References

  1. Heikenfeld et al. (2019). Devices Capable of Fluid Sample Concentration for Extended Sensing Analytes. U.S. Patent No. 10,506,968 B2. U.S. Patent and Trademark Office.
  2. Choi D-H, Thaxton A, Cheol Jeong I, et al. Sweat test for cystic fibrosis: Wearable sweat standard sensor vs. standard laboratory test. J Cyst Fibros. 2018:35-38. doi:10.1016/j.jcf.2018.03.005
  3. Huang X, Liu Y, Chen K, et al. Stretchable, Wireless Sensors and Functional Substrates for Epidermal Characterization of Sweat. Small. 2014;10(15):3083-3090. doi:10.1002/smll.201400483
  4. Sonner Z, Wilder E, Heikenfeld J, et al. The microfluidics of the eccrine sweat gland, including biomarker partitioning, transport, and biosensing implications. doi:10.1063/1.4921039
  5. Wang Y, Gallagher E, Jorgensen C, et al. An experimentally validated approach to calculate the blood-brain barrier permeability of small molecules. doi:10.1038/s41598-019-42272-0
  6. Chung M, Fortunato G, Radacsi N. Wearable flexible sweat sensors for healthcare monitoring: A review. J R Soc Interface. 2019;16(159). doi:10.1098/rsif.2019.0217
  7. Seshadri DR, Li RT, Voos JE, et al. Wearable sensors for monitoring the physiological and biochemical profile of the athlete. doi:10.1038/s41746-019-0150-9

The Near-Electromagnetic Spectrum Is Just a Name

Humans require oxygen for everyday life. It is a key component in many body functions so it logically follows that measuring oxygen and oxygen usage in the body can be extremely beneficial. Healthcare and sports are two main fields that come to mind. On the market today, there are hundreds of devices that measure various  body metrics and oxygen levels and saturation are no exception. One device that measures the the oxygenation saturation in body tissues is a portable near-infrared spectroscopy (NIRS) apparatus created by Gutwein et al.[1]. Gutwein et al. applied for a patent titled “Method and Apparatus for Assessing Tissue Oxygenation Saturation” on March 22, 2017 and the patent  was approved and filed roughly 5 months later on September 28, 2017. Gutwein et al. also had a previous patent “Portable Near-Infrared Spectroscopy Apparatus” filed in October 2016. The basic patent information is outline below[1]:

  1. Patent title: Method and Apparatus for Assessing Tissue Oxygenation Saturation
  2. Patent number: US 2017/0273609 A1
  3. Patent filing date: March 22, 2017
  4. Patent issue date: September 28, 2017
  5. Inventors: Luke G. Gutwein, Clinton D. Bahler, Anthony S. Kaleth
  6. Assignee: Indiana University Research and Technology Corporation
  7. U.S. Classification: CPC – A61B: 5/14552, 5/6807, 5/02055
  8. Claims: 20

Invention & Claims

This invention is an apparatus and method developed for assessing tissue oxygenation saturation during physical activity. The portable near-infrared spectroscopy (NIRS) apparatus comprises of a wearable article of clothing, namely a shirt, pair of shorts or a calf sleeve. It also contains a spectroscopy probe, a near-infrared light source and a photodetector coupled to the article of clothing used. The probe is configured to measure oxygenation saturation in skin dermis, adipose tissue (fat) or muscle fascial layer[1].

Figure 1. Image depicting user wearing device. The wireless probe can be incorporated into different wearable articles.

Why Is This Important?

There is a need for such a device in a multiple fields, namely healthcare and sports. This NIRS apparatus has applications in clinical settings, sports industry and in exercise physiology research. Clinicians, doctors and researchers can benefit from a portable NIRS device in monitoring and diagnosing disease states, including:

  • septic shock
  • real-time tissue perfusion analysis during surgery
  • peripheral arterial disease

The NIRS device is highly sensitive to changes in Muscle tissue oxygenation (StO2) and during exercise, the NIRS signal is considered to reflect  the balance between oxygen delivery and utilization. This can have multiple applications in sports including looking at how efficient oxygen flow is and to show what muscles are specifically being activated and which aren’t; this can indicate whether or not proper form is being used[1].

Tech Talk: How It Works

NIRS is an optical technique that allows for continuous non-invasive monitoring. This technique is founded on the Beer-Lambert Law. The Beer- Lambert Law is a linear relationship between absorbance and concentration of an absorbing species[2].

Where A is the measured absorbance, a(𝜆) is the wavelength-dependent absorptivity coefficient, b is the path length, and c is the analyte concentration.

The NIRS device measures hemoglobin oxygen saturation in microvessels (arterioles, capillaries, venules) by applying this Beer-Lambert Law and the using the differences in light absorption coefficients of oxyhemoglobin and deoxyhemoglobin. The device uses these absorption characteristics to calculate changes in oxygenated & deoxygenated hemoglobin in skin, fat, or muscle tissues[1].

What Sets It Apart?

Early devices that measured oxygenation saturation were mostly limited to research usage. Since then there have been advances in the field leading to the creation of smaller probes and utilizing wireless probes instead. The PortaMon created by Artinis Medical Systems (B.V. Netherlands) is currently the most common portable NIRS device on the market. There are still problems with these devices however. Namely issues with:

  • Device size
  • Motion signal artifacts
  • Adipose (fat) tissue thickness

The size of the probe is based off the required penetration depth. In order to get the 2-6 cm of depth required, the probes tend to be bulkier. Another issue is motion signal artifacts that raise questions concerning the reliability of some devices. These artifacts are created by instabilities (for example, lose of contact) at the skin-probe interface. Finally, the thickness of the adipose tissue can limit the depth of penetration achieved[1].

The main advantage of this device is that it can measure levels in skin, fat or muscle tissue over any sport or activity including running, bicycling, swimming and weightlifting. Some additional features are that this NIRS device and method can measure the user’s heart rate, respiratory rate and body temperature[1].

Citations:

[1] Gutwein et al. (2017). Method and Apparatus for Assessing Tissue Oxygenation Saturation. US 2017/0273609 A1. U.S. Patent and Trademark Office

[2] Beer-Lambert Law. (n.d.). Retrieved March 10, 2020, from http://life.nthu.edu.tw/~labcjw/BioPhyChem/Spectroscopy/beerslaw.htm

Still yet further another Exercise Machine again

In stark contrast to the common forms of weight training is isometric training, in which instead of moving weights the goal is to try as hard as you can and FAIL to move it.[1] This form of training has been shown to elicit increased strength development in some ways, and is often used in rehabilitation settings and is being used increasingly in recreation gym use. Unfortunately, these gains are also seen specifically in the joint angles that are trained. [1] This means that if you’re doing an isometric bicep curl with your elbow at 90 degrees, you’ll only develop strength at that 90 degree angle, not angles far from it.

To apply this training to the full range of joint motion, Isokinetic exercises can be used. Isokinetic exercises are exercises that are performed at constant speeds, regardless of how strongly one pushes or pulls. This allows for an isometric-like training across all joint angles. Studies have shown in some capacities isokinetic training leads to rapid growth, such as in jump athletes in which high speed isokinetic training had tenfold faster improvements when compared to other exercise groups[2].

In order to do isometric exercise, however, special exercise machines that move only at fixed speeds must be used. For elite training and physical training aspects, being able to regulate the speed as well as read out the force the user is applying to the machine to log their efforts. BIODEX is a company that designs isokinetic dynamometer exercise machines that do just that.

The Invention

  • Patent Title:
    1. Muscle exercise and/or rehabilitation apparatus using linear motion
  • Patent Number:
    1. US490777A
  • Patent filing date:
    1. May 25, 1988
  • Patent issue date:
    1. March 13, 1990
  • How long it took:
    1. 22 months
  • Inventors:
    1. Walter Gezari, Daniel Y. Gezari
  • Assignee
    1. Biodex Corporation
  • US Classification
    1. A63B21/154: Using flexible elements for reciprocating movements (ropes, chains, special pulley assemblies
    2. A63B21/0058 Exercising apparatus for developing or strengthening the muscles or joints of the body by working against a counterforce, with or without measuring devices using electromagnetic or electric force-resisters using motors
    3. Y10S482/90 Ergometer with feedback to load or with feedback comparison
    4. Y10S482/901 Exercise devices having computer circuitry
  • How many Claims:
    1. 24

This invention is an isokinetic dynamometer exercise machine used to simulate a whole body lift, as often done in manual tasks at a workplace. For example lifting up a box and placing it on an overhead shelf. This is a common function and one that needs to be rehabbed in injured manual labor populations in which goals include returned to work, and having a machine that works specifically on that function can be useful. This more accurately replicates the stresses on the spine as well as supporting muscles, ligaments, and tendons than a surrogate exercise would.

The claims on this patent describe all parts of the physical apparatus. As can be seen in the image above, this includes the base on lockable wheels upon which the user stands on. The user then holds onto the handles and attempts to slide the bar up along two vertical guide poles. Ropes are rigidly fixed to the bottom and top of the bar and are held vertical by passing through pulleys directly above and below the bar. These pulleys redirect the rope towards a wheel, upon which it tightly winds around.

This effectively converts the linear motion of the bar and rope to the rotational motion of the wheel. There is a shaft that rotates along with this wheel which connects to a dynamometer and a servo motor to fulfill it’s claims of being able to measure the speed and force at which the user moves the bar as well as control the speed at which the user can move the bar. This dynamometer filed under a different patent (US4691694) and as such will not be covered in the context of this post.

But this dynamometer doesn’t actually read the force or the linear speed at which the user is moving the bar. It’s reading rotational measures: torque and angular velocity. This information needs to go through some postprocessing in order to get the linear values. As the radius of the wheel is known, the conversion is done by the following equations:

Force  = Torque / Radius

Linear Velocity = angular velocity * radius

When the device is used for isokinetic motions in which the speed is controlled, the servo motor is engaged, which controls how the shaft and wheel rotate, therefore controlling the rope and the bar that the user is trying to lift. A servo motor is a motor that can rotate in both directions a certain amount at a certain angular velocity. This angular velocity is also calculated based the equations above and the desired linear speed set by the users.

Prior art has simulated the exercise of lifting as done in the workplace but they haven’t had any control systems for speed prior to this one. There have also been prior works that use servo motors to control rotational motions but not linear ones as lifting workplace items tends to be. The linear systems in the past have used other techniques that use force readouts of the person during exercise to determine the speed at which the exercise should be done, but these require complex systems with real time computation in order to function, and the motion may not be smooth as a result.

In comparison to these prior arts, this patent is novel in its ability to simulate linear loads in isokinetic ways, in being simple in doing so, and having a smooth motion in doing so as well.

Citations:
[1]Smith, M. J., & Melton, P. (1981). Isokinetic versus isotonic variable-resistance training. The American Journal of Sports Medicine, 9(4), 275–279. doi: 10.1177/036354658100900420
[2]Folland, J. P., Hawker, K., Leach, B., Little, T., & Jones, D. A. (2005). Strength training: Isometric training at a range of joint angles versus dynamic training. Journal of Sports Sciences, 23(8), 817–824. doi: 10.1080/02640410400021783

Use the Force (and/or Motion)

The Basics

Patent Title: Force and/or motion measurement system having inertial compensation and measurement thereof

Patent Number: US8315823

Patent Filing Date: June 30, 2011

Patent Issue Date: November 20, 2012 (17 months to issue)

Inventors: Necip Berme and Hasan Cenk Guler

Assignee: Bertec Corporation

U.S. Classification: Force or Torque Measurement (702/41)

Claims: 18

Some Background on Force Measurement Systems

Biomedically, force sensors are used to continuously measure a force that is being exerted by the person on the platform. They measure forces in three dimensions and plot them against time [1]. Force plates are becoming increasingly more popular with sports researchers and coaches who are looking to use more advanced technology to help improve the performances of their athletes. An example of an athlete who may benefit from using a force measurement sensor is a swimmer who is looking to improve their starts and turns [3]. Sprinters also may use these inventions to work on pushing off a starting block.

The Bertec force measurement system [2], specifically, aims to relate the force or motion measured with inertial compensation. The force plate can take the form of a balance plate or jump plate, as well as gait using a treadmill-like apparatus. An important distinction of this device compared to other force plates is that it also assesses the motion of the athlete. The invention utilizes a motion acquisition system to look at the movement of a person running or walking on the treadmill.

What are the Main Claims?

The Bertec force measurement system [2] is made up of a force measurement assembly which includes a surface for the subject to stand on and one or more force transducers. This invention also includes a motion base, an inertial compensation system, and a means of data manipulation. The motion measurement system described in this patent also claims the same components and functions. There is a method for determining the forces or moments that are applied to the system which includes rotating the assembly with the subject in multiple dimensions, acquiring force and moment quantities using the transducer, and mathematically correcting the values.Figure 1. Bertec force measurement system [2]Figure 2. Bertec force and motion measurement system with treadmill and motion capture system [2]

How it Works

A key component of the device is the inertial compensation system [2], which uses linear or rotational profiles to calibrate the device and determine the inertial parameters. The motion base uses applied motion profiles to displace force and is especially good for supporting a treadmill system, as it can hold a large weight that undergoes motion. Below are the equations used to describe the force-inertia relationship.

The top equation illustrates the inertial forces and the bottom equation represents the moments. The kinematics of the force measurement assembly (aG and w) can be measured using accelerometers and gyroscopes respectively.

Compared to Other Devices

The main difference between Bertec’s device and devices that came before it is its ability to switch out the means of acquiring data. The force and motion measurement system is able to be used with a motion capture system and treadmill or with a force plate which allows for versatility in training measurements. This makes it simpler for coaches to view the force and motion values associated with their athletes’ performances and makes improvements off of the reported values.

References

[1] Leno, P. (2019, October 30). How to use force plates in sports. Retrieved from https://training-conditioning.com/news/how-to-use-force-plates-in-sports/

[2] Berme et al, Force and/or motion measurement system having inertial compensation and method thereof, US8315823, Bertec Corp, 2012

[3] Kistler. (2020). Biomechanics: faster, higher and stronger with performance analysis measuring technology. Retrieved from https://www.kistler.com/en/applications/sensor-technology/biomechanics-and-force-plate/sports-biomechanics/

It’s Bioelectric! Boogie, Woogie, Woogie!

The Patent 

  • Patent title: Bioelectrical impedance measuring apparatus constructed by one-chip integrated circuit
  • Patent #: 6472888
  • Patent filing date: Jan. 29, 2001
  • Patent issue date: Oct. 29, 2002
  • How long it took for this patent to issue: 1yr and 9mo
  • Inventor(s): Oguma, Koji, Miyoshi, Tsutomu
  • Assignee: Tanita Corporation
  • US classification: 324/691; 324/692; 600/547
  • How many claims: 9

The Invention

Bioelectrical impedance apparatuses (BIA) estimate the body composition of the individual by sending a small electrical impulse through its tissues. The speed of this electrical current varies due to the water, muscle, and fat content in the tissues [1]. Tissues containing higher water and muscle content tend to have faster electrical currents, and thus, a lower impedance; whereas, tissues containing higher fat content tend to have slower electrical currents, and thus, a higher impedance [1]. Other factors, such as sex, height, and weight, are also considered when using this device. [2]

Having been available to the public since the 1980’s [1], this recent 2001 patent improves upon the original BIA by scaling down all the necessary processes onto a one-chip microcomputer [2]. The essential components of a BIA include: inputting patient information, applying electrical current, integrating bioelectrical impedance, and outputting one’s body composition, all of which remain withstanding [2]. The one-chip microcomputer is useful for 1) selectively generating and relaying an alternating-current (AC), 2) containing multiple switches that measure bioelectrical impedance, send the AC signal, and quantify the output voltage, and 3) containing devices that produce, supply, and detect voltage [2]. Overall, the inventors sought to maintain the effectiveness of the current solution whilst minimizing the amount of compartments needed to output one’s body composition.

Figure 1. Bioelectrical Impedance Analysis Schematic. The body is composed of fat or fat-free mass and water or water-free tissues (A) [8]. These different components result in different resistances, and thus, different impedances. Moving through water encounters less resistance than moving through fat (C) [8]. To measure impedance, the circuit connects to 2 electrodes placed at the wrist and 2 placed at the ankle (B) [8]. 

The Population

BIA can prove to be an effective tool for quantifying one’s body composition in clinical studies, more specifically studies whose population consists of individuals from developing countries [3] due to its low cost, portability, ease of use, and reliability [4]. Additionally, bioelectrical impedance analyzers are available for commercial use and offered from online retailers, such as Amazon [5]. Like an Apple Watch or Fitbit, one may resort to purchasing a BIA in means of receiving information regarding their body constitution in a timely fashion. Using an age limit similar to a Fitbit, individuals below the age of 13 should not make use of a BIA [6]. Moreover, the curiosity over one’s weight, body mass index, and body composition has been trending over the last decade, and is directly related to the booming health and fitness industry [7]. Aside from its current uses, BIA deems to be a probable technique for detecting the presence of abnormalities in the body (i.e. lesions and/or tumors) [2].

The Engineering

As previously stated, BIA relies on an electrical current that passes through various regions of high to low water, muscle, or fat content in order to decipher one’s body composition. This technique assumes the body exists as conductive cylinders, uniform in material and density, and fixed in cross-sectional area [3].In addition, BIA assumes that the body’s conductive volume is reflective of its water composition [3]. With these assumptions in mind, the formula that is used to estimate the contribution of a body part’s weight to the whole body resistance is as seen in equation 1.

V=p x S^2/R                (1)

The variable V represents the conductive volume; p represents the receptivity of the conductor; S represents the length of the conductor; and R represents the resistance of the cross-section area [3].

Two electrode configurations are used to measure four impedance values in the body – one from each electrode – and to decipher whether an anomaly has occurred [2]. The impedance analyzer makes use of a signal generator, sensor, switch, and drive and measurement electrodes in order to produce and measure a signal [2]. The principle behind Ohm’s Law (equation 2) is used to calculate the voltage difference between the two electrode configurations as current flows through the body [9]. For BIA measurements, electrodes are often placed at the wrist and ankle [9].

V=I x R                (2)

Impedance is the ratio between voltage and current, V/I, and is often represented as the variable, Z [9]. Moreover, Z is dependent upon resistance, R, and reactance, X, and can be expressed using the formula in equation 3.

Z=(R^2+X^2)^1/2            (3)

Engineers often use assumptions to simplify biological processes while also attempting to retain the maximum amount of information in said processes. Based on the assumptions that make up equations 1 and 3, researchers often encounter accuracy issues when analyzing BIA measurements [9]. To combat this, these equations can be manipulated so that they are only effective when the sample is reflective of its reference population’s impedance formula [9].

The Improvement

The one-chip microcomputer expands on prior solutions as it integrates all circuits that measure impedance onto a single platform. The inventors specifically compare their design to that of a body fat meter. In summary, the body fat meter makes use of a microcomputer, yet, continues to employ other instruments to calculate impedance, which results in 1) a large apparatus, 2) increased labor to create the circuit board, and 3) heightened likelihood of encountering noise [2]. In synopsis, the one-chip microcomputer allows for downsizing, offers a cheaper alternative, and reduces the margin for error. Additional patents use BIA to monitor abnormalities in the body [10], analyze organ output [11], or improve instrumentation of the device [12].

Figure 2. Patent Drawing. The above image displays the compartments needed to measure impedance on a one-chip microcomputer [2]. 

References

  1. Bioelectrical Impedance Analysis (BIA). Science for Sport. Website. https://www.scienceforsport.com/bioelectrical-impedance-analysis-bia/. Published May 20, 2018. Accessed February 27, 2020.
  2. Oguma, Koji, Miyoshi, Tsutomu. Bioelectrical impedance measuring apparatus constructed by one-chip integrated circuit. 2002.
  3. Dehghan, M., Merchant A.T. Is bioelectrical impedance accurate for use in large epidemiological studies? Nutr J. 2008; 7: 36. doi: 10.1186/1475-2891-7-26
  4. Essa’a, V.J., Dimodi, H.T., Ntsama, P.M. et al. Validation of anthropometric and bioelectrical impedance analysis (BIA) equations to predict total body water in a group of Cameroonian preschool children using deuterium dilution method. Nutrire. 2017; 42: 20. https://doi.org/10.1186/s41110-017-0045-y
  5. Bioelectrical Impedance Analysis. Amazon. Website. https://www.amazon.com/bioelectrical-impedance-analysis/s?k=bioelectrical+impedance+analysis. c1996-2020.  Accessed March 8, 2020.
  6. Terms of Service. Fitbit. Website. https://www.fitbit.com/us/legal/terms-of-service. Updated September 18, 2018. Accessed March 8, 2020.
  7. The Six Reasons The Fitness Industry Is Booming. Forbes. Website. https://www.forbes.com/sites/benmidgley/2018/09/26/the-six-reasons-the-fitness-industry-is-booming/#6c6e04e3506d. Published September 26, 2018. Accessed March 8, 2020.
  8. Grossi, M., Ricco, B. Electrical impedance spectroscopy (EIS) for biological analysis and food characterization: a review. J Sens Sens Syst. 2017; 6: 303-325. https://doi.org/10.5194/jsss-6-303-2017
  9. Bioelectrical Impedance Analysis in Body Composition Measurement. U.S. Department of Health & Human Services. https://consensus.nih.gov/1994/1994BioelectricImpedanceBodyta015html.htm. Published December 12, 1994. Accessed March 8, 2020.
  10. Chetham, Scott, M. Apparatus for connecting impedance measurement apparatus to an electrode. 2014.
  11. Kaiser, Willi, Fideis, Martin. Apparatus and method for obtaining cardiac data. 2007.
  12. Chetham, Scott, Daly, Newton, C., Bruinsma, John, I. Measurement apparatus. 2016.


A Look into Air Displacement Plethysmography

All information about this Air Displacement Plethysmography Chamber was retrieved from this patent: Air Circulation Apparatus and Methods for Plethysmographic Measurement Chambers 

Air Displacement Plethysmography

This air displacement plethysmography chamber is used to assess the body composition of patients. The measurements of fat and fat-free mass allow physicians to record important physical information about patients. Excess body fat and low levels of free-fat mass are indicators of various different diseases and developmental problems.  The major claim of the device is that air displacement plethysmography determines the volume of a patient by measuring the amount of air displaced when the patient sits in an enclosed chamber. This invention specifically includes an apparatus and plethysmographic measurements chamber that use air that has circulated through the chamber and replaced with air from outside the chamber in order to record its measurements. [1]

Who uses it?

Physicians primarily use air displacement plethysmography within the populations of infants and obese individuals. For low birth weight infants, variations in body composition can dictate infant energy needs and can indicate the health progression and future physical development of the infant. Air displacement measurements for infants must be more accurate than other body composition determining techniques because of an infant’s metabolic rate and longer measurement periods required due to their larger breathing artifacts. Excess body fat within obese individuals can be indicators of diseases such as cardiovascular disease, diabetes, hyper tension, hyperlipidemia, kidney disease, and musculoskeletal disorders. Athletes can also use this technology to determine their body composition to ensure that they are at peak physical shape for their required sport. [1]

How it works: A little bit of engineering for you

In air displacement plethysmography, the volume of air in the chamber is calculated through Boyle’s Law and/or Poisson’s Law. In most technologies, volume perturbations of a fixed frequency of oscillation are induced with the chamber and the perturbations lead to pressure fluctuations. The amplitude of the pressure fluctuations is determined and is used to determine the amount of air in the chamber through Boyle’s Law (isothermal conditions) or Poisson’s Law (using adiabatic conditions). [1]

Boyle’s Law: For gases at room temperature, there is an inversely proportional relationship between pressure and volume of that gas. [2]

P1V1 = P2V2

Where,

  • P1 is the initial pressure of the gas
  • V1 is the initial volume of the gas 
  • P2 is the final pressure of the gas 
  • V2 is the final volume of the gas

Poisson’s Law: In an adiabatic process, no heat transfer takes place between the surroundings and the system, or within the system. [3]

(P1V1)^Y= (P2V2)^Y

Where,

  • P1 is the initial pressure exerted by the gas
  • V1 is the initial volume occupied by the gas
  • P2 is the final pressure exerted by the gas
  • V2 is the final volume occupied by the gas
  • Υ is the ratio of specific heats, CP/ CV

By subtracting the volume of air remaining in the chamber (when the subject is in the container) from the volume of air in an empty chamber, body volume can be calculated indirectly.

Once the volume of the subject is known, body composition can be found with the volume, the weight, and the surface area of the subject. Body composition can be found by using the relationship between density and percent fat mass. The following two equations can be used to determine percent fat mass: 

Siri’s Equation: Percent Fat Mass=(4.95/Density)-4.5)*100) 

Brozek’s Equation: Percent Fat mass=((4.57/Density)-4.142)* 100)

Where,

Density= subject mass/subject volume

[1]

Better Than the Rest

There are other methods out there used to determine body composition, but they contain flaws compared to air displacement plethysmography. One method is skin folding, which uses calipers that compress the skin at certain points on the body. This technique is inaccurate in accounting for variations in fat patterning and requires perfect application of the calipers by a technician. Biometric impedance analysis (BIA) is also used to determine body composition. This technique requires the passing an electric current through a patient’s body, measuring its impedance value and comparing it to the known impedance value of muscle tissue thus to determine body composition. This method is not effective because impedance can be affected by the patient’s state of hydration, internal and external temperature, and BIA has not been used on infants. Lastly, the most common technique used to measure body composition is hydrostatic weighing. This process includes weighing the patient on land and repeatedly underwater to estimate the amount of air present in their lungs. This technique is incredibly invasive and unpleasant, especially for the populations of infants, the elderly, and individuals with disabilities. Air plethysmography is used because it is a less invasive technique for the populations of interest and it provides more accurate readings of body composition. [1]

There are a few components of the invention in the patent that differentiate it from other air displacement plethysmography devices. This plethysmographic measurement chamber prevents the accumulation of water vapor and carbon dioxide in the chamber, it addresses variations in chamber temperature due to body heat produced by the subject, and it maintains a safe and comfortable air composition for infants. All of these measures are due to internal systems and methods of circulating and renewing air within the chamber, while also maintaining the acoustic properties of the chamber at the perturbation frequency used to conduct the volume measurements. [1] 

Patent Information

The information from this post was retrieved from the following patent:

Patent Title: Air circulation apparatus and methods for plethysmography measurement chambers

Patent Number: US 2004/0193074 A1

Patent Filing Date: March 26, 2003

Patent Issue Date: September 30, 2004

How long it took for this patent to be issued: About 1.5 years 

Inventors: Philip T. Dempster, Michael V. Homer, Mark Lowe 

Assignee: Fish & Neave 

U.S. Classification: 600/587; 73/149

Amount of Claims: 57

[1]

Detailed Drawing

Figure 1: Labeled drawing of an air plethysmography displacement system with the following labeled components: 50. Entire plethysmographic system,  52. Plethysmographic measurement chamber, 54. Chamber door, 56. Plethysmographic measurement components, 58. Volume perturbation element, 60. Air circulation chamber, 62. Plethysmographic measurement components, 64. Computer, 66. Software for controlling operation of measurement components, 68. Inlet tube, 70. Exhaust tube [1]

References

  1. Dempster et al. (2004). Air Circulation Apparatus and Methods for Plethysmographic Measurement Chambers.  US 2004/0193074 A1. U.S. Patent and Trademark Office 
  2. (2019) Boyle’s Law – Statement, Detailed Explanation, and Examples. Retrieved from https://byjus.com/chemistry/boyles-law/
  3. (n.d.) Adiabatic Process. Retrieved from http://hyperphysics.phy-astr.gsu.edu/hbase/thermo/adiab.html

How Wrist Pedometers Count Steps

Patent title: Adaptive Step Detection

Patent number: US 20130191069A1

Patent filing date: 01/18/2013

Patent issue date: 07/25/2013

Time it took for the patent to be issued: Just over 6 months

Inventor: Sourabh Ravindran

Assignee: Texas Instruments Incorporated

U.S. classification: G01C22/006 Pedometers

Number of claims: 7


Today, there are many different types of pedometers that are used by athletes and non-athletes alike. Brands such as Garmin, Fitbit, and Apple make smart watches that allow users to track their steps, distance covered, and floors climbed all while reading text messages and playing music. However, before these complex devices, people still used pedometers to track their steps. Traditional pedometers were worn on clipped to the waist and tracked steps based on the movement of the hips. This patent was filed by Texas Instruments Incorporated for a pedometer that would be worn on the wrist instead of the hip. Devices like this helped pave the way for the popular smart watches worn today. 

The main claim of this pedometer is that it can be worn on the wrist and can track steps as accurately as traditional pedometers worn on the hip (figure 1). The another main claim of this device is that it uses three accelerometers to track step data to account for sway and extraneous movements of the arm during daily life. The device also has the capacity to store data, which can be exported to other devices, such as a computer via USB or Bluetooth. In addition, the device has a screen to display step count or distance traveled. 

Figure 1. The design drawing of the wrist pedometer (600). 514 indicates the screen that will display the users step count, the distance traveled, or the time. 516 indicates a button that can be used to select what is displayed on the screen.

Traditional pedometers were worn on the belt and steps were detected based on the motion of the hips. Movement at the wrist is more complex and can result in more false steps than pedometers worn on the hip. The algorithm used to determine what is registered as a step was altered to account for this more complex motion. To do this, a three axis accelerometer was used to make motion detectable regardless of how the arm was oriented. Data from each axis is filtered and combined by summing the absolute value of each sample. The result is one graph that represents all of the acceleration data in order to get a more accurate depiction of when steps were taken (figure 2).


Figure 2. The graph of the combined waveform data from each of the three (x, y, and z) accelerometers. 322 and 323 indicate regions around inflection points, 330 points out a region where the amplitude of the slope exceeds the allowable threshold, 331 indicates the time duration of the positive slope region, and 333 indicates where the time threshold was exceeded for an inflection point region. When each threshold value is met, a step is registered for that particular sloping region.

 Using this plot, an adaptive peak detector is utilized in the hardware to quantify the acceleration of each movement. This detector identifies inflection points in the acceleration data collected to identify positive and negative slopes in the accelerations. If the slope regions reach or surpass a threshold value and last for a specified time threshold, then the device registers this as a step. The time restraint helps separate noise from actual step data. The detector then repeats this to track steps over time. Step frequency and the height of the user are determined in order to estimate stride length so that distance covered can also be output to the user. A study conducted showed that this device on the wrist is just as accurate as an older pedometer that was worn on the hip. 

Though the mechanisms used to count steps seem rather complex, this device could be used by anyone looking to track their daily steps. This device does not require any difficult training to use so learning how to use the device should not be a limiting factor for this device. Pedometers are used by people of all athletic abilities. If someone wants to begin exercising, this device could be used to track the number of steps accumulated during the day or during a particular workout. An avid runner could use this device to track the distance covered during a run based on stride length and step count. Therefore, this device can be widely used and may be of benefit to anyone trying to increase their physical fitness. Current wrist pedometers have exceeded the functions of this device, incorporating heart rate monitors, swim tracking, GPS tracking, and other technologies. The patent described some of these functions as potential future adaptations/embodiment of this device.


Reference:

Ravindran, S. (2013). US Patent No. US 2013/0191069A1. Retrieved from https://patents.google.com/patent/US20130191069?oq=intitle%3Aadaptive+intitle%3Astep+intitle%3Adetection

How Garmin Watch Heart Rate Monitors Work

Using a GPS watch has become the norm in distance running. These watches provide users with information regarding distance traveled, pace, and even maps of the route taken. Newer watches also include heart rate monitors, providing users with greater information about their fitness. The popular watch brand, Garmin, has a patented heart rate monitor [1] used in their watches, seen in Figure 1 below. 

Figure 1. Back of Garmin watch with heart rate monitor device (labeled “610”) [1].

The heart rate monitor in Garmin watches monitors cardiac signals via the user’s wrist. The main claims of this invention are as follows:

  • The device consists of an emitter, receiver, inertial sensor, and time-variant sensor. The processor determines frequency associated with the motion signal, transforms the signal from PPG into the frequency domain, identifies the cardiac component of the PPG signal, configures a time-variant filter, and calculates the time between cardiac component cycles.
  • The device emits a light signal and receives an input of the light’s reflection, which eventually allows for the isolation of the cardiac component of signal.
  • The cardiac component of signal allows for heart rate to be determined.
  • The time between successive cycles gives insight into heart rate variability, stress, recovery time, VO2 max, and/or sleep quality.
  • The device contains an interface that displays determined information to the user.

This device would be of interest to any Garmin watch user, especially those interested in heart rate during exercise. This watch, primarily used by runners, tells the user their heart rate and therefore how fast their heart is pumping blood through the body at any given time during exercise. This gives insight into the user’s fitness and exertion levels and ensures the user is in desired heart rate zones while training. Knowing how heart rate changes personally affect the user can also give insight into dehydration, stress, and needed recovery. Using this device over an extended period of time allows for users to see improvements in heart rate due to exercise.

How Does it Work?

The heart rate monitor in Garmin watches directs light from a light-emitting diode (LED) to the skin of the user. The reflection of the light is received by a photodiode, which sends a light intensity signal to the processor. The processor generates a photoplethysmogram (PPG) signal – containing cardiac, motion (determined by an inertial sensor, which senses movement of the device), and respiratory components – based on the intensity of the reflected light.

To isolate the cardiac component of the PPG signal, time-variant filters are used to remove non-cardiac components. The PPG signal can initially be filtered with a bandpass filter that only passes signals within the range of possible cardiac component frequencies. This bandwidth can be adjusted by the processor to account for lesser or greater expected cardiac frequencies based on changes in the environment. For example, if the user begins running, the processor senses rapid motion change and the bandwidth will increase since heart rate is expected to rise.

To determine which other signals to remove within the passband, the processor first identifies one or more frequencies associated with the motion signal via the inertial sensor. The processor then transforms the PPG signal into the frequency domain. Comparing the identified motion signal frequencies with the transformed PPG signal allows for the cardiac component of the signal to be determined within the frequency domain. Then, based on the identified cardiac component, the processor is able to determine filter coefficients for the cardiac component which are configured into the time-variant filter. When the PPG signal is transformed back into the time domain and filtered through this time-variant filter, the motion component is removed from the PPG signal. This results in a time domain PPG signal without the motion component, making it easier to identify the cardiac component of the PPG signal in the time domain. See Figure 2 below for a flowchart describing this filtering process.

Figure 2. Flowchart describing the process of isolating heart rate from PPG signal [1].

The processor does not need to identify frequencies of the motion signal for every time point. It identifies these frequencies within the PPG signal for an initial time period, configures a filter to remove these frequencies, then uses the same filter to filter the motion signal from subsequent time periods of the PPG signal.

The device is also capable of storing memory. This allows for the device to create a model of expected cardiac component frequencies from previously determined data. Based on the model, the processor can then determine the probability of any given frequency within the PPG signal to be a frequency of the cardiac component.

Heartbeat and respiratory patterns are cyclical over a short period of time while motion data and noise can be cyclical or irregular for any length of time. Over a longer period of time, cardiac and respiratory signals can potentially have non-cyclical patterns (e.g. increasing heart rate during an exercise session). This allows for the variability in cardiac parameters to be determined. Analyzing variability in heart rate allows for estimates of parameters of stress, recovery time, VO2 max, and sleep quality.


This patent cites numerous references of inventions this device incorporates or improves upon. This device improves on a previous wrist-watch heart rate monitor (patent 2009/0048526), which was developed as an alternative to wearing a chest strap heart rate monitor. The Garmin device is different from this wrist-watch as this device does not include any inertial sensors. Therefore the Garmin device is able to better remove noise from motion [2]. Another exercise device by Samsung Electronics (patent US 7,867,142 B2) uses heart rate data to inform users about changes in their exercise speed by playing a sound. While the Garmin device does not play a sound, it uses the heart rate data to extrapolate information about stress, recovery time, VO2max, and sleep quality, which is likely to be of greater value to the user [3].

The following lists basic information regarding the Garmin heart rate monitor patent:

  1. Patent title: Heart Rate Monitor With Time Varying Linear Filtering
  2. Patent number: US 9,801,587 B2
  3. Patent filing date: Oct. 18, 2016
  4. Patent issue date: Oct. 31, 2017
  5. How long it took for this patent to issue: 1 year, 13 days
  6. Inventors: Paul R. MacDonald, Christopher J. Kulach
  7. Assignee: Garmin Switzerland GmbH
  8. U.S. classification: CPC: A61B 5/02416 (20130101); A61B 5/1112 (20130101); A61B 5/1118 (20130101); A61B 5/7285 (20130101); A61B 5/721 (20130101); A61B 5/02405 (20130101); A61B 5/02427 (20130101); A61B 5/02438 (20130101); A61B 5/0833 (20130101); A61B 5/486 (20130101); A61B 5/4815 (20130101); A61B 5/681 (20130101); A61B 5/725 (20130101); A61B 5/7278 (20130101); A61B 5/165 (20130101); A61B 2562/0219 (20130101)
  9. How many claims: 29 claims


References:

[1] P. R. MacDonald and C. J. Kulach, “Heart Rate Monitor With Time Varying Linear Filtering.” U.S. Patent 9,801,587 B2, issued October 31, 2017.

[2] R. M. Aarts and M. Ouwerkerk, “Apparatus for Monitoring A Person’s Heart Rate And/Or Heart Variation; Wrist-Watch Comprising The Same.” U.S. Patent 2009/0048526 A1, issued February 19, 2009.

[3] S. K. Kim, J. S. Hwang, and K. H. Kim, “Method and Apparatus for Managing Exercise State of User.” U.S. Patent 7.867,142 B2, issued January 11, 2011.

The Sports Gene Chapter 2 Reflection: 10,000 Hours Rule

Make-up blog for 3/3/20

This week’s chapter of The Sports Gene focused on the “10,000 hours rule”, or the idea that a person can become an elite athlete by deliberately practicing their sport over thousands of hours. The main example that was looked at was the case of high jumper, Stefan Holm, who is one of the top high jumpers in the world despite the disadvantage of having a shorter height. He started training from a very young age and follows a very specific training plan which has led him to success in the sport. Comparatively, the book looked at another high jumper, Donald Thomas, who picked up the sport later in life and was not as trained in the technicalities of high jumping.

One of the distinguishing characteristics of the athletes that is interesting is the achilles tendon in each of them. When Holm’s achilles was studied, they found that it had become so stiff over time that it required quite a bit of force to bend it, making it act as a spring. This is a characteristic that was developed over time with training. Thomas, on the other hand had a very long achilles relative to his height which is something that cannot be developed over time. It is interesting to see how different characteristics of the achilles are beneficial for the same sport and that they are acquired in different ways.

I don’t believe that the 10,000 hour rule is relevant to all sports or to all people. In the case of Holm, it probably did apply to him due to him not being naturally built like most professional high jumpers. He was obviously very dedicated to the sport and putting in the deliberate practice is what helped him become successful. However, some people are naturally gifted athletes who can pick up a sport much more easily than the average person.

Epstein, D. (n.d.). Chapter 2. In The Sports Gene (pp. 18–37).

Myofascia-nating, does myofacial release work?

Many people envision an evening under the hands of a masseuse as the perfect example of a relaxing experience, even as those hands dig deep into the “hurts so good” territory. This is often justified with the long term effects promised as the gain to the pain, such as relief of chronic pain, reduced soreness, and feeling looser. These claims are primarily backed by anecdotal evidence rooted in experiences of clients ranging from casual massage goers to professional athletes, as well as from those of practitioners.

Ubiquitously coined by masseuses, physical therapists, and athletic trainers, myofascial release is one of those deep soft tissue massage techniques that gets people excited to let them above their personal pain thresholds. But does myofascial release have any scientific evidence behind it’s effectiveness?

But what really is myofascial release?

The theory is that a primary factor in muscle tightness and pain is the condition of the sticky, gooey web that holds our muscle fibers together and to other parts of our body.

Fig 1: Fascia around and between layers of muscle

Originally posed by physician Stephen Typaldos came the idea that virtually all musculoskeletal injuries were due to distortions of connective tissue, particularly when sticky masses of fascia clump in between muscular fibers. Myofascial release is the practice of, in theory, releasing these fascial clumps to relieve tension on the musculoskeletal system. Dr. Typaldos found a lot of success in his career by using rubbing, friction, sliding, and pulling on acute pain- success that has inspired practitioners to adopt his strategies and aim for the best results.  However, while clumps of fascia melting away is easy to visualize, there is no scientific proof that distortions actually exists, nor that they can be removed by manual work. Some argue that fascia doesn’t even matter while others swear by it and pose theories to back their claims, but currently the mechanism, if any, behind myofascial release is unknown.

There is also no common consensus over how myofascial release is really used. For example, some professionals apply myofascial release to trigger points, which don’t seem to be related to fascia at all as per the video below:

Of course, for anyone looking for relief from pain and soreness myofascial release sounds like a good idea, but the costs of repetitively visiting therapists and masseuses is a deterrent. Thus enters the market of self myofascial release including products such as rollers and massage tools, where one can supposedly achieve myofascial release at home without the need of a practitioner. However, things get a little murky here as well – some argue that these techniques can’t actually achieve myofascial release, and there is no proof in either direction:

https://www.youtube.com/watch?v=BnYdzaoMyQ8

Ultimately, these grievances are rooted in the lack of understanding over the mechanism behind myofascial release. Even as these techniques aren’t tightly defined, we’re still left wondering the question: “But does it work?”

Does the massage work?

This one is tricky to answer, using scientific evidence, as there is a lack of high quality, highly controlled studies I myofascial release massage. A 2013 review on the effect of myofascial release on adults with orthopedic conditions found only 10 peer reviewed articles on the topic. Of these, 6 were case studies of which 5 had degrees of improvement ranging from slight to full recovery, and one on which the treatment failed. Of course, there is no way of knowing if massage really had any effect on those results. Of the studies, it was found that in treating plantar fasciitis, hamstring tightness, and misaligned pelvis myofascial release was useful (especially in plantar fasciitis, with on average 60% better pain reduction than the group without three months down the line!. However, the study with the largest subject was on low back pain, in which it was found that myofascial release did improve back pain, but no better than other manipulation techniques. There was no control in this study, however, so again it’s hard to tell if time alone healed all the subjects. With only one randomized control study (plantar fasciitis), I concurred with the authors here that there was a greater need for stronger studies on the subject.

A 2017 review looked only at randomized controlled trials where individuals and personnel were blinded to which treatment group they belonged in. Only 8 were found, all of which indicated myofascial release was beneficial. The conditions studied were tennis elbow and low back pain. Among these, two of them found that myofascial release on top of physical therapy was more useful than just physical therapy.

As we can see here, there really aren’t many conclusive studies on the matter, without a big enough sample of studies to draw a consensus from. I’ll agree it looks like from what we’ve seen myofascial release therapy seems to help, but only two of the above studies actually compare it to fake massage or other massage techniques. While those two studies found myofascial release was better than faking a massage, two are hardly enough to conclude that myofascial release is responsible for reduced pain and not just any massage. Looking at a third study, we see that there is no significant difference between myofascial release and Swedish massage in pain symptoms.

Okay…but what about foam rollers?

An example of a foam roller

Many people use foam rollers as a cheaper alternative to hands on massage to achieve myofascial release. It doesn’t look like we’re sure if myofascial release is even a real thing, but let’s not just go throwing our rollers out feeling dejected and lied to all along. Even if we aren’t sure how foam rollers work, they may still help.

One study looked at 20 gym-going males and how foam rolling affected them while doing a resistance squat and jump height protocol. They were evenly and randomly split into a foam rolling group and non foam rolling group. The study found that throughout their training which consistent of five consecutive days of exercise, the group that foam rolled had consistently lowered muscle soreness and improved range of motion at each time point. The participants that foam rolled did not have better gains in their squat one rep max, but did have better jump height improvement in comparison to the control. One limitation of this study is that the control group had no replacement to foam rolling, such as just laying down on foam, after their workouts, so there could have been another factor involved in the difference between the two groups.

Another study looked at the effect of foam rolling in delayed onset muscle soreness (DOMS), in which a squat regiment was used to induce the pain in both the no foam rolling and foam rolling group, who foam rolled immediately afterward the workout and then 24 hours later and 48 hours later for 20 minutes each time. The foam roller group had significantly reduced muscle soreness and increased tenderness of the quadriceps. The athletes had recorded performance measures such as sprint time and squat reps before the DOMS protocol, and the group the foam rolled had less reduction of performance 24, 48, and 72 hours after. Again, we can say the lack of a more robust control condition applies here, but again the results are promising.

So lets roll it all together

Even though it looks like overall we’re really not too sure what myofascial release massage is, how it works, or if its effective, we can still draw some conclusions from the research. The first is that myofascial release isn’t harmful. With neither the foam rollers or the manual massage did pain increase for subjects or performance decrease. Its true that myofascial release could be no different than any other massage in it’s effects, but they trend to show that whether or not a release of clumps of fascia occurs, the massage does help with pain for certain cases. The same thing goes for foam rolling the legs. Maybe no form of release is occurring at all, but spending the time to foam roll is showing to increase flexibility and reduce soreness at least over the span of time that DOMS is a factor. Importantly, there is no case here to say that if you feel like myofascial release helps you that there is any reason to give it up.


Questions to Consider:

Is it important to know how myofascial release works or just that it does work? If you had limited resources and to support one of those two types of studies, which would it be?

Are randomized controlled trials important to understanding how effective myofascial release is? Or is that being too strict, and looking at case studies and less controlled studies is sufficient enough? Why?

References:

Meltzer, K. R., Cao, T. V., Schad, J. F., King, H., Stoll, S. T., & Standley, P. R. (2010). In vitro modeling of repetitive motion injury and myofascial release. Journal of Bodywork and Movement Therapies, 14(2), 162–171. doi: 10.1016/j.jbmt.2010.01.002

Whitehead, M., Jeffrey, E., khurana, A., Gail, Oster, D., Wilson, S., … Miller, C. (2018, March 8). Self Myofascial Release- What is MFR and how does it work? Retrieved from https://deeprecovery.com/is-myofascial-release-real/

Ingraham, P. (n.d.). Fascia Science Review. Retrieved from https://www.painscience.com/articles/does-fascia-matter.php#sec_origins

Problems MFR Helps. (n.d.). Retrieved from https://www.myofascialrelease.com/about/problems-mfr-helps.aspx

American Fascial Distortion Model Association. (n.d.). Retrieved from https://afdma.com/

Mckenney, K., Elder, A. S., Elder, C., & Hutchins, A. (2013). Myofascial Release as a Treatment for Orthopaedic Conditions: A Systematic Review. Journal of Athletic Training, 48(4), 522–527. doi: 10.4085/1062-6050-48.3.17

Laimi, K., Mäkilä, A., Bärlund, E., Katajapuu, N., Oksanen, A., Seikkula, V., … Saltychev, M. (2017). Effectiveness of myofascial release in treatment of chronic musculoskeletal pain: a systematic review. Clinical Rehabilitation, 32(4), 440–450. doi: 10.1177/0269215517732820

Liptan, G., Mist, S., Wright, C., Arzt, A., & Jones, K. D. (2013). A pilot study of myofascial release therapy compared to Swedish massage in Fibromyalgia. Journal of Bodywork and Movement Therapies, 17(3), 365–370. doi: 10.1016/j.jbmt.2012.11.010

Macdonald, G. Z., Button, D. C., Drinkwater, E. J., & Behm, D. G. (2014). Foam Rolling as a Recovery Tool after an Intense Bout of Physical Activity. Medicine & Science in Sports & Exercise, 46(1), 131–142. doi: 10.1249/mss.0b013e3182a123db

Pearcey, G. E. P., Bradbury-Squires, D. J., Kawamoto, J.-E., Drinkwater, E. J., Behm, D. G., & Button, D. C. (2015). Foam Rolling for Delayed-Onset Muscle Soreness and Recovery of Dynamic Performance Measures. Journal of Athletic Training, 50(1), 5–13. doi: 10.4085/1062-6050-50.1.01