


The Women’s Caucus has collated excerpts of data below that was received from UD’s Office of Institutional Research and Effectiveness. We want to thank the Office of Institutional Research and Effectiveness for working with us year after year to provide this data. The most complete year of data used for this report was 2020.
As the Women’s Caucus continues to advocate for equitable treatment for all employees, we continue to pursue data that allows us to trace patterns in sex, gender, and race identifications among faculty and staff. The data below shows some of the sex, gender, and race distributions across the different categories of employees.
Personnel Categories:
Faculty at UD- Percentage of Female Compared to Male by Rank
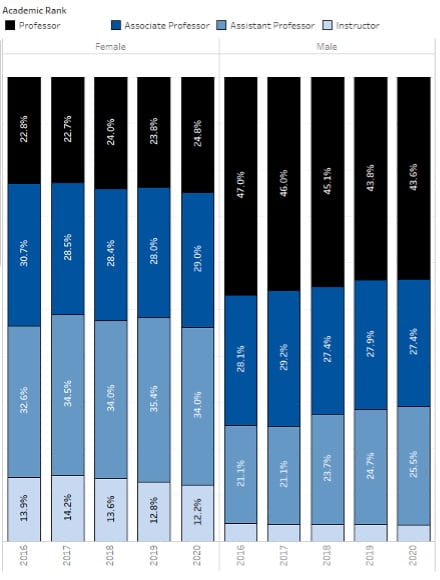
The chart above shows the comparison between female (left) and male (right) faculty and their representation at each rank from professor through instructor. In 2020, the percentage of full-time female faculty at the professor rank was the lowest among all of the ranks, despite consistent year-over-year growth in the percentage of women in this rank.
Faculty by tenure status and gender, 2020
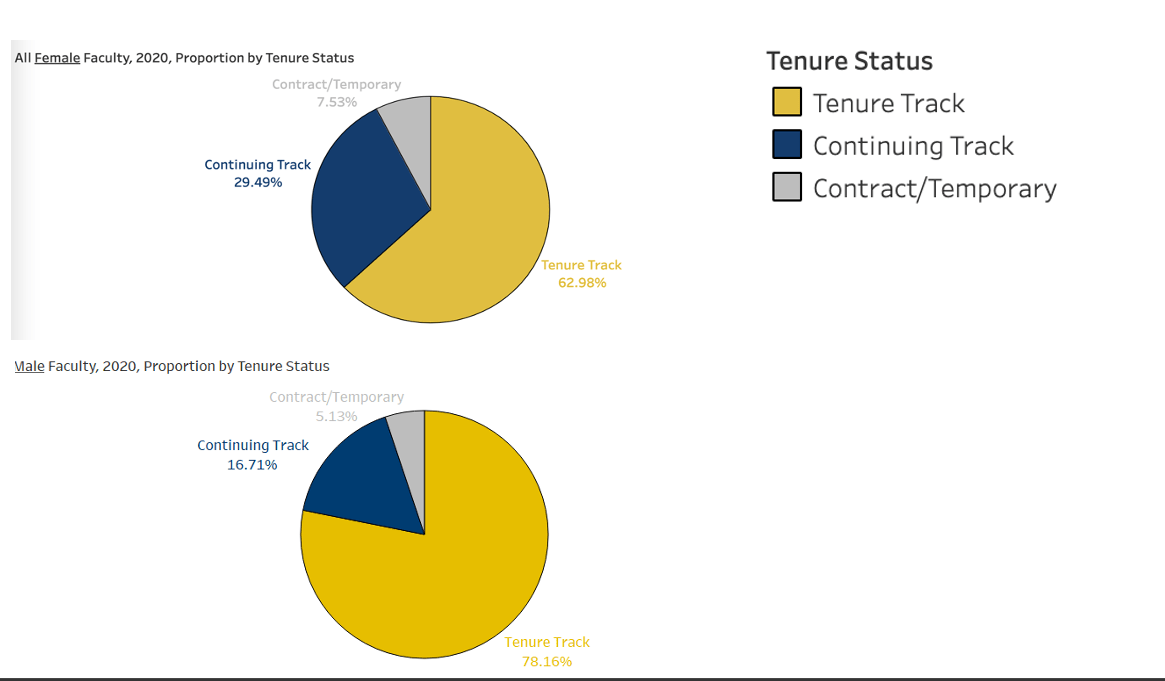
These charts show that there were more female than male continuing track and contract/temporary faculty members in 2020. This trend has been consistent over the years.
Faculty at UD – Percentage Female and Male Faculty of Color
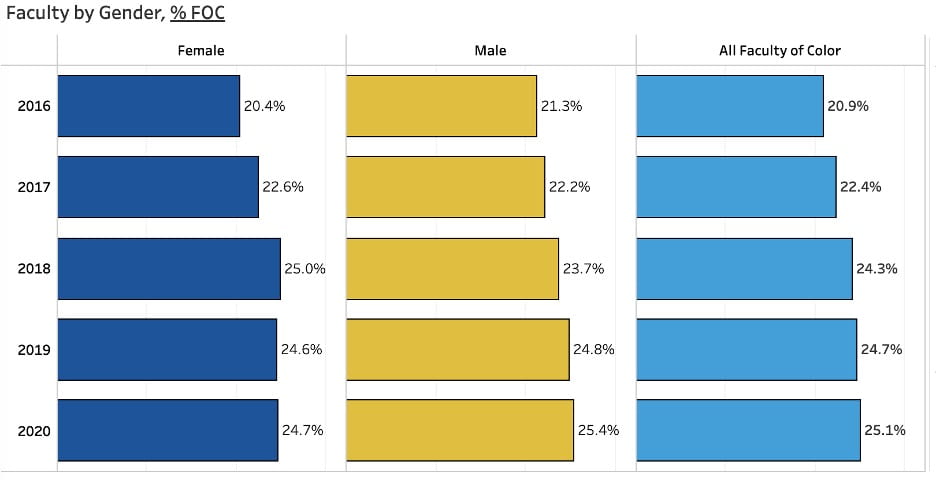
This chart shows the percentage of female and male faculty of color working at UD over time. Faculty of color includes persons who identify as one or more of the following ethnicity categories: American Indian, Black, Hispanic, Hawaiian/Pacific Islander, and Asian.
Faculty at UD – Percentage of Female Compared to Male in Leadership Roles

This chart shows the comparison between female and male faculty in leadership roles over time. These roles include Academic Center Directors, Chairs, Deans, Provosts and others.
Staff at UD: Female by Time Status and Gender

The top line graph shows the percentage of female staff at UD over time 2016-2020 for exempt staff, non-exempt staff and hourly staff. The bottom bar chart shows the comparison between female and male staff in the three main employment categories in 2020. The percentage of female staff in non-exempt roles was the highest and female staff in hourly roles was the lowest.
Staff at UD – Domestic URM by College
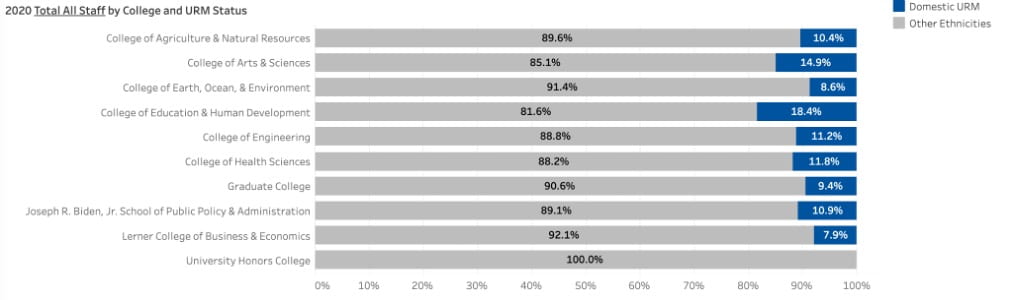
This chart shows the percentage of domestic underrepresented minorities (URM) working at UD by college in 2020. We note that previous annual reports showed staff of color, here we display Domestic URM for detailed reporting. The highest percentage of Domestic URM in any college was 18.4% in the College of Education and Human Development.
Salary categories:
Faculty at UD: Full-Time Salary Ratio Female:Male

This graph shows the female to male ratio of full-time faculty salaries over time. In 2020, we note the continued progress in the category of chairperson/director. No category has a ratio of $1:$1.
Staff at UD: Full-Time Salary Ratio Female:Male
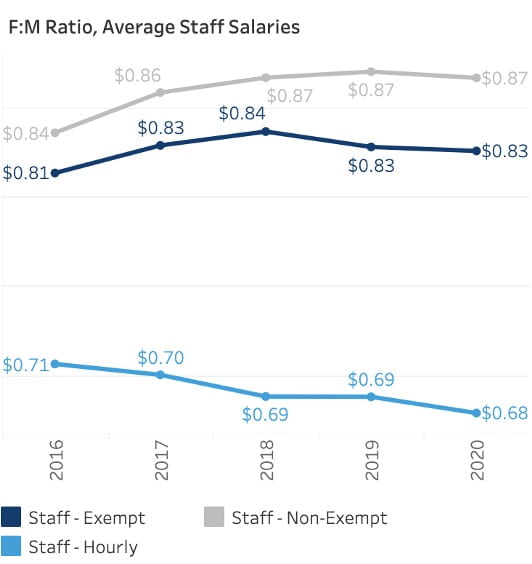
This graph shows the female to male ratio of full-time staff salaries over time for the three main employment categories. The ratio was closest to one dollar for non-exempt staff and furthest from one dollar in the hourly category.