

Board of Trustees
According to the Charter of the University of Delaware (UD), “the Board of Trustees shall have the entire control and management of the affairs of the University.” The Board is composed of four ex-officio members, eight members selected by the governor, and 20 members elected by the board itself. For 2018, women held 12 of the 33 positions.
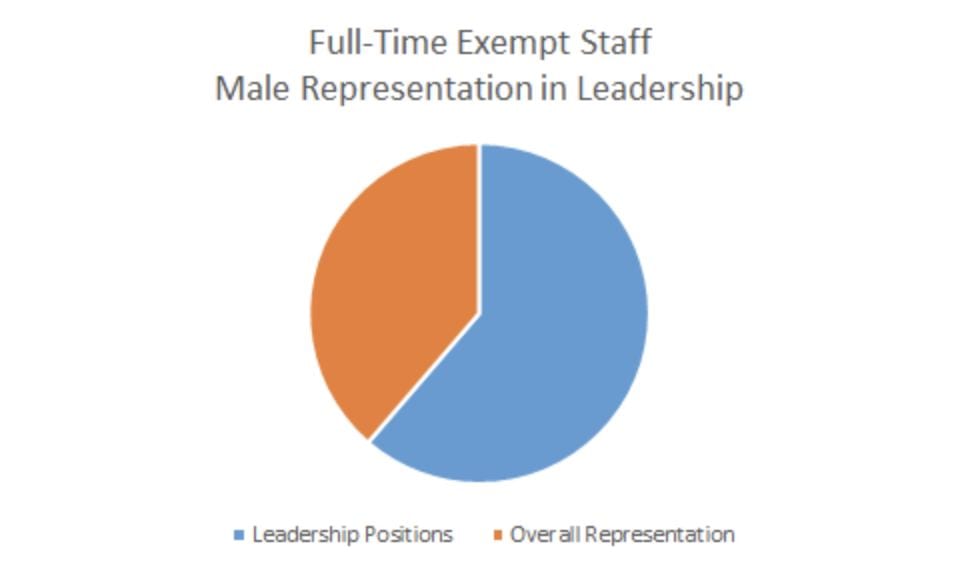
Leadership Positions
During the fall of 2017, women occupied a variety of leadership positions across the university. Data provided by UD’s Institutional Research and Effectiveness shows that 65% of the staff in leadership positions (leadership categories include every job title level: i.e., Interim/Acting, Associate, Vice, Deputy, etc.) are male, while males only comprise 41% of full-time exempt staff overall. 65% of faculty members with administrative appointments are male, compared to males representing 56% of full-time faculty overall.

Faculty and Staff Numbers
The University of Delaware includes four categories of employees: exempt staff, non-exempt staff, hourly workers, and faculty members.
Employees with different classifications have different access to benefits, including sick leave and job flexibility. Certain staff classifications are represented by unions and others are not. As the Women’s Caucus continues to advocate for equitable treatment for all employees, we continue to pursue data that allows us to trace patterns in sex, gender, and race identifications among staff. Additionally, we want to understand the different roles and responsibilities played by staff members. The data discussed below shows some of the sex, gender, and race distributions across different categories of employees.
The overall UD workforce is majority female (55%), but some categories of employees are more gendered than others. Females comprise nearly three-quarters, 73%, of full-time non-exempt employees and 59% of exempt employees. Females make up larger percentages in all categories of part-time employees being 68% of part-time faculty, 100% of part time non-exempt staff, and 77% of part-time exempt staff members.
Numbers of Full-Time/Part-Time Faculty
| Faculty | ||||||
| Full-Time | Part-Time | |||||
| Year | # Women | # Men | % Women | # Women | # Men | % Women |
| 2006 | 446 | 738 | 37.7% | 21 | 14 | 60.0% |
| 2007 | 454 | 731 | 38.3% | 23 | 11 | 67.6% |
| 2008 | 451 | 737 | 38.0% | 25 | 12 | 67.6% |
| 2009 | 461 | 724 | 38.9% | 29 | 15 | 65.9% |
| 2010 | 467 | 739 | 38.7% | 25 | 17 | 59.5% |
| 2011 | 478 | 739 | 39.3% | 29 | 13 | 69.0% |
| 2012 | 475 | 735 | 39.3% | 31 | 13 | 70.5% |
| 2013 | 478 | 726 | 39.7% | 34 | 16 | 68.0% |
| 2014 | 483 | 720 | 40.1% | 32 | 17 | 65.3% |
| 2015 | 496 | 711 | 41.1% | 29 | 14 | 67.4% |
| 2016 | 514 | 712 | 41.9% | 20 | 10 | 66.7% |
| 2017 | 556 | 720 | 43.6% | 20 | 10 | 66.7% |
Numbers of Full-Time/Part-Time Staff
In two categories, full-time faculty and hourly staff, women are a minority, comprising 44% of full-time faculty and 32% of hourly workers. The 2017numbers reflect an increase in the representation of women among full-time faculty from 39% in 2011 to 44% in 2017 and among exempt employees from 57% in 2011 to 59% in 2017.
| Staff | ||||||||||
| FT Non-Exempt | PT Non-Exempt | FT Exempt | ||||||||
| Year | # Women | # Men | % Women | # Women | # Men | % Women | # Women | # Men | % Women | |
| 2006 | 664 | 201 | 76.8% | 89 | 6 | 93.7% | 670 | 591 | 53.1% | |
| 2007 | 660 | 206 | 76.2% | 81 | 5 | 94.2% | 687 | 596 | 53.5% | |
| 2008 | 684 | 206 | 76.9% | 82 | 9 | 90.1% | 700 | 588 | 35.9% | |
| 2009 | 671 | 217 | 75.6% | 72 | 4 | 94.7% | 727 | 601 | 36.7% | |
| 2010 | 645 | 219 | 74.7% | 74 | 6 | 92.5% | 775 | 615 | 36.0% | |
| 2011 | 622 | 219 | 74.0% | 65 | 6 | 91.5% | 835 | 622 | 35.2% | |
| 2012 | 594 | 205 | 74.3% | 66 | 6 | 91.7% | 862 | 656 | 33.9% | |
| 2013 | 583 | 197 | 74.7% | 56 | 5 | 91.8% | 923 | 663 | 33.3% | |
| 2014 | 569 | 206 | 73.4% | 64 | 6 | 91.4% | 975 | 679 | 33.3% | |
| 2015 | 566 | 208 | 73.1% | 59 | 4 | 93.7% | 1037 | 712 | 32.1% | |
| 2016 | 581 | 204 | 74.0% | 34 | 0 | 100.0% | 1079 | 742 | 31.5% | |
| 2017 | 629 | 235 | 72.8% | 29 | 0 | 100.0% | 1108 | 769 | 31.6% | |
| Staff | |||||||
| PT Exempt | Hourly | ||||||
| Year | # Women | # Men | % Women | # Women | # Men | % Women | |
| 2006 | 82 | 22 | 78.8% | 162 | 296 | 35.4% | |
| 2007 | 81 | 27 | 75.0% | 164 | 292 | 36.0% | |
| 2008 | 82 | 27 | 75.2% | 162 | 289 | 35.9% | |
| 2009 | 83 | 27 | 75.5% | 163 | 281 | 36.7% | |
| 2010 | 87 | 27 | 76.3% | 158 | 281 | 36.0% | |
| 2011 | 74 | 28 | 72.5% | 150 | 276 | 35.2% | |
| 2012 | 87 | 21 | 80.6% | 137 | 267 | 33.9% | |
| 2013 | 88 | 17 | 83.8% | 140 | 281 | 33.3% | |
| 2014 | 88 | 24 | 78.6% | 135 | 270 | 33.3% | |
| 2015 | 83 | 19 | 81.4% | 130 | 275 | 32.1% | |
| 2016 | 49 | 10 | 83.1% | 121 | 263 | 31.5% | |
| 2017 | 17 | 5 | 77.3% | 125 | 270 | 31.6% | |