Sweat Sensor Channel Geometry

Identify

Soft microfluidics revolutionized the development of sweat sensors by providing increased flexibility so the device can be worn on the skin while an individual is exercising. The material selected for these sensors is important for the flexibility and comfort of these devices. Elastomers with a low modulus but high elasticity are typically chosen as they allow the user to easily move while still obtaining sufficient sweat collection by close contact and flexibility upon the skin [1]. As these types of materials can more easily deform, it is important to consider the geometric design of these microfluidic channels. It is important the sweat sensor can withstand external forces or pressures, such as the individual touching the sensor, especially during exercise. These channels should not easily deform as significant deformation could greatly interfere with the volume of sweat collected, in addition to other measurements like sweat rate and the measured analyte concentrations.

It is important to first understand how externally applied forces influence the deflection of the microfluidic channels. We can then understand how the volume of these channels changes in response to applied forces which will allow us to select the optimal geometry that minimizes the change in volume to increase the accuracy of the device in realistic conditions [2]. If we want to account for externally applied forces that might be applied to the sweat sensor during use, should we design narrow or broad channels? Should there be considerations for height? To understand these questions, we will need to understand how the width and height ratio of microfluidic channels influences the percentage of volume change within these channels.   

Formulate

To solve this problem, we will assume that the applied pressure acts as a uniformly distributed vertical load across the channel width. For simplicity we will only be calculating the results for a single channel, but the principles could be used to calculate the entire surface of the sweat sensor. Since the channels of sweat sensors are often rectangular, we will model the sweat sensor as a rectangular beam that is fixed on both ends. Once the sweat sensor is placed onto the skin we are assuming it is permanently in place as any movement of the sensor would ruin the obtained results. We are also assuming the channel has uniform thickness.

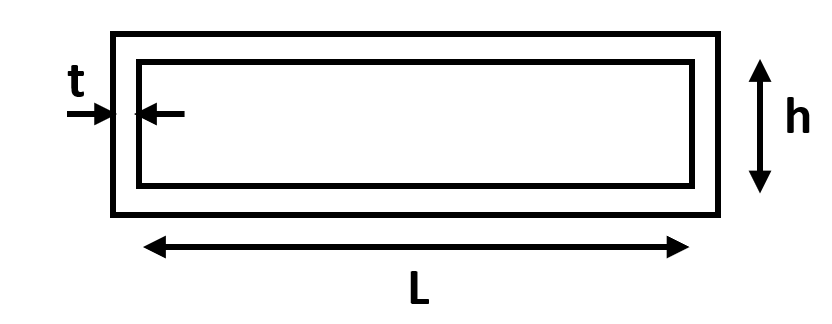
Figure 1. Cross section of microfluidic channel. For our calculations, L will be the width of the channel, h the height of the channel, and t the thickness of the channel. The channel length is a.

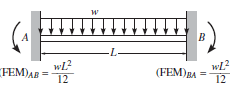
Figure 2. Channel free body diagram. Free body diagram of a beam fixed at both ends with uniform distributed loading applied [3]. L is the width of the channel.

Solve

The free body diagram of Figure 2 can be solved to find the vertical reaction forces at the fixed ends. By symmetry, the two vertical reaction forces are equal to the force of the distributed load which is the load times the length. Each vertical reaction force is equal to wL/2.

We can calculate the bending moment equation by making a cut in the beam to understand internal forces and moments and solve for the bending moment.

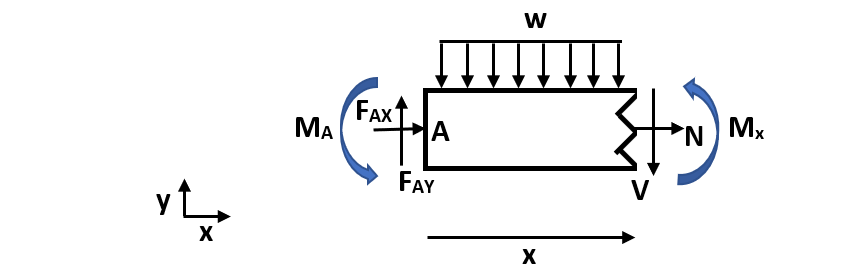
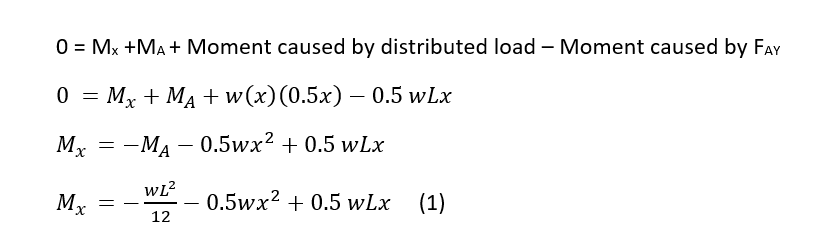
Figure 3. Cut channel section. In this figure, w is the distributed load, N is the normal internal force, V is the internal shear force, Mx is the internal moment at an arbitrary cut, FAX and FAY are reaction forces at fixed end A, and MA is the fixed end moment at A. Mx is defined in the positive direction and x is an arbitrary length along the total width (L) of the beam.

Solve for the bending moment equation:

The sum of the moments equals 0 and any horizontal forces do not create a moment about point A. As shown in Figure 2, the moment about a fixed end for a uniform distributed load is equal to wL2/12. 

Calculate deflection:

Calculate change in volume:

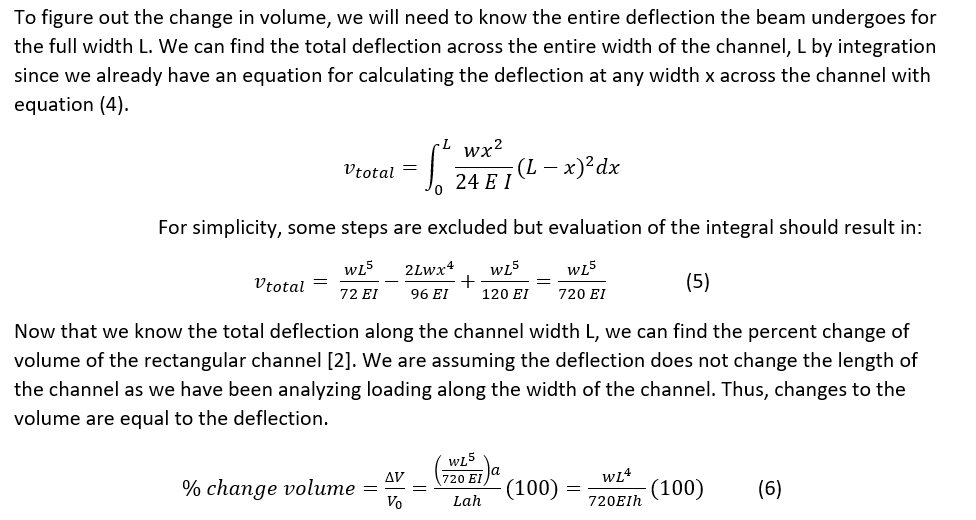
Equation (6) gives us the relationship between the width (L) and the height (h) of the channel so we can understand how the channel geometry influences the change in volume of the channel with externally applied forces. A positive change in volume is reasonable as our deflection of the channel was positive as well. These results were also found in a study analyzing colorimetric sweat sensors that found that narrow channels had a smaller volume change compared to broad channels [1]. There are several limitations to these calculations for practical applications. We analyzed the influence of deflection that caused a change in the height by vertical loading, but realistically the forces might have other components. Depending on how the sweat sensor adheres to the skin, the assumption of fixed ends may not always apply. There may also be instances in which the force applied is not uniformly distributed, but may act at a specific point.

Although the channel height is important to consider, the channel width is a much greater influence on the change in volume of the channel with deflection as it is raised to the fourth power. The height is only raised to the first power which has a less impact on the change in volume when considering external forces. We should aim to use narrow channels in the microfluidic channel design of our sweat sensor compared to broad channels as increasing the width increases the amount of deflection of the channel by equation (5) and produces a greater change in the volume of the channel.


References

[1]. Koh A, Kang D, Xue Y, et al. A soft, wearable microfluidic device for the capture, storage, and colorimetric sensing of sweat. Sci Transl Med. 2016;8(366):366ra165-366ra165. doi:10.1126/scitranslmed.aaf2593

[2]. Rogers, John, et al. Soft, wearable microfluidic systems capable of capture, storage, and sensing of biofluids. United States Patent WO2017218878 A1.  United States Patent and Trademark Office. 16 June 2017.

[3]. Engineering Stack Exchange. Structural engineering – How to determine fixed end moment in beam? https://engineering.stackexchange.com/questions/15040/how-to-determine-fixed-end-moment-in-beam. Accessed May 14, 2020.

Resistance Temperature Detector Calibration for Sweat Sensors

Glucose and Lactate are two analytes in sweat that would be highly desirable to apply sweat sensing technology to, each for their own individual reasons. Since the biosensing technology typically used to detect these analytes utilizes enzymatic reactions, temperature of the sample being tested must be taken into consideration when interpreting results due to its effects on enzymatic activity. Therefore, temperature sensors are an essential component of any sweat sensor that aims to give reliable feedback on either/both of these analytes. Multiple temperature sensing technologies exist, but a simple, commonly used technology is resistance temperature detectors (RTDs). These simple circuits use a Wheatstone bridge with a pure metal resistor that is exposed to the sample being tested. That resistor has a temperature-dependent resistance, and its resistance affects the voltage output of the Wheatstone bridge. In order to calibrate your sensor (a necessary process to ensure it gives accurate results), you must be able to use voltage outputs of known temperatures to identify the relationship between voltage and temperature. This problem will help us learn to do so.


Problem Statement

The Wheatstone bridge shown below (figure 2.) has four resistors, three of equal resistance R=10Ω and one temperature-varying platinum resistor RT. A voltage VE=1V is provided to the system by a battery as shown. Vo is defined as the voltage difference between points a and b, and is given by the general Wheatstone bridge equation provided below (figure 1.). Resistance RT is given by RT = R0(1+α(T-T0), where α is the temperature coefficient of platinum, α= 0.00385/°C. Given that R0= 10Ω and T0=0°C…

a. Write an equation for Vo in terms of T

b. Find Vo at T=20°C, T=30°C, and T=40°C

c. Devices aren’t always exact. Your RTD is giving values of Vo(20)=19.0mV, Vo(30)=28.3mV, and Vo(40)=37.2mV. Plot these values and find a line of best fit for your RTD (assuming linear relationship*)

d. Find the voltage Vo that would be expected at T=37°C

Figure 1. Wheatstone bridge equation

Figure 2. RTD setup

*Assumptions:

  • Linear relationship between Vo and T- RTDs display much more linear behavior than thermocouples. They are not exactly linear, but for the purposes of this problem and learning how to calibrate, it is a fair assumption. It will cause the most error in the middle of our range of estimation, due to the parabolic nonlinearity of the true relationship between Vo and T. [1]


Solution

Figure 3. The written solutions for a, b, and d

Figure 4. Plot for part c

The algebra for solutions to parts a, b, and d of the problem are provided in figure 3. The plot for part c, created in Excel, is provided in figure 4. This plot was created by creating a column of temperature data and a column of the corresponding voltage data given in the problem statement for part c, highlighting those two columns, and creating a scatter plot. A line of best fit was added to the plot, and the equation for the line was displayed on the graph itself. Excel makes linear approximations for data sets like these very easy. While the linear approximation may not be the best fit for our data set, it appears to be very accurate, with an Rvalue of 0.9998. Our final answer for Vo at 37°C makes sense, given that 34.45mV is between the values for 30°C and 40°C, 28.3mV  and 37.2mV, respectively, and closer to that of 40°C. The linear approximation we made is a limitation of this solution. For a sweat sensing technology that gives medically relevant feedback to the user, we would want our analyte sensing results to be as accurate as possible, which would involve a curve-fitting technique as opposed to a linear approximation for our RTD. With the linear calibration we performed, we could use the values of Vo received from our RTD to determine the temperature of samples between 20-40°C with a pretty high level of accuracy.


References

[1] Trump, B. (2011). Analog linearization of resistance temperature detectors. Retrieved from http://www.ti.com/analog-circuit/aaj-article.html

Tired of Blood Tests? Don’t Sweat it! (Or do, I Suppose)

I think I stand with the majority of the population when I say that I do not like needles. Blood work, as I’m sure you can imagine, is not really my cup of tea. As I sit there in that dreadfully uninviting chair with a rubber tourniquet tied way-too-tightly-for-comfort around my upper arm, I find myself wishing there was a less invasive alternative, ideally one that doesn’t leave me with a puncture wound. Well, luckily for me and any other sane individual who shares my distaste for needles, the future looks bright. Sweat has historically been overlooked as a biosensing platform despite carrying many of the same biomarkers, chemicals, and solutes that are carried in blood. This stems from a variety of different complications associated with sweat sensing that simply don’t exist for blood tests, and these complications have been enough to prevent any significant progress in the field for a long time. It was not until a group of scientists from the University of Cincinnati were issued an intriguing patent on January 22nd of this year that the field of sweat sensing technology began to see hope.

Now all of that is a bit dramatic, but let’s be real. How many of you would have kept reading if I started off with “Devices for integrated, repeated, prolonged, and/or reliable sweat stimulation and biosensing” (the official name for the patent in question)? I’m sure sweat stimulation isn’t something you planned on spending a great deal of time thinking about today, but you’re here now and boy let me tell you, this is exciting stuff. US patent number 10182795 could have some major implications in the near future across multiple facets of life. Inventors Jason Heikenfeld and Zachary Cole, working out of the assignee of the patent, the University of Cincinnati, have put forth some novel approaches to addressing the complications associated with sweat biosensing, specifically the inability to consistently gather enough sweat from one area for testing, skin irritation, and the contamination of sweat samples from chemicals used to stimulate sweating, like pilocarpine. Their patent, filed on October 17, 2014 and classified under CPC A61B 5/1491 (using means for promoting sweat production), among other classifications, describes a medical technology that has potential for a wide-ranging impact, and the many claims they make (13 to be exact) sound promising.

So let’s talk about the invention. At its core, it’s a method of sweat stimulation and sampling through device-skin interface that could be deployed through a variety of different mediums, including patches, bands, straps, clothing, wearables, etc. Utilizing multiple sweat stimulation pads controlled by a timing circuit capable of selectively activating/deactivating individual pads, this technology is able to rotate through the pads over time. This prevents skin irritation caused by the single-pad, continuous sweat stimulation that has been used in this design’s predecessors, and also allows more consistent sweat collection due to the rotation between fresh sweat stores. One commonality between this design and previous sweat sensors is the method of sweat stimulation, but even within that apparent commonality there are improvements that have been made. While this design still plans to use a molecular method of drawing sweat out of the skin, like pilocarpine, it also includes a filtration component, or membrane, to ensure purity of the sweat sample collected. Once collected, the sample is pumped to a sensor by a microfluidic component to analyze the concentration of the analyte of interest for that sensor. The design can be seen in better detail below.

The inventors claim that this device will collect and analyze sweat over extended periods of time through the components and methods described above. If that is in fact true, this technology could soon be in use everywhere. From athletes seeking to maximize their body’s performance to nurses caring for neonates to patients undergoing pharmacological monitoring, this technology could be a real breakthrough in systemic biomarker detection. Why bother with a needle when you can get the same information by slapping a patch on your arm? This patent has the potential to render most blood tests for analytes present in sweat obsolete. There is likely still a long road ahead before it reaches the market, and it may very well end up like the vast majority of US patents that never make it there. But I know I’ll be on the lookout for clinical trials over the next 5-10 years. I hope you will too.

Reference

Heikenfeld, Jason C., Sonner, Zachary Cole. (2019). United States Patent No. 10182795B2. Retrieved from http://pdfpiw.uspto.gov/.piw?PageNum=0&docid=10182795&IDKey=263AB8D65766%0D%0A&HomeUrl=http%3A%2F%2Fpatft.uspto.gov%2Fnetacgi%2Fnph-Parser%3FSect1%3DPTO2%2526Sect2%3DHITOFF%2526p%3D1%2526u%3D%25252Fnetahtml%25252FPTO%25252Fsearch-bool.html%2526r%3D3%2526f%3DG%2526l%3D50%2526co1%3DAND%2526d%3DPTXT%2526s1%3Deccrine%2526s2%3Dsensor%2526OS%3Deccrine%252BAND%252Bsensor%2526RS%3Deccrine%252BAND%252Bsensor