Using NIRS to non-invasively monitor muscle oxygenation during exercise

Skeletal muscles are the basis of all movement in the human body, and athletes work years to train their muscles to be powerful yet efficient. Even if a single muscle could allow a person to lift a car, it would not be very useful if the muscle could no longer create forceful contraction again for several hours. The muscle also must be efficient in the use of oxygen, ions, and other substrates that allow for contraction to be able to quickly recover and be prepared for repeated contraction. Muscle oxygenation is particularly important for both endurance and power of a muscle because it is necessary to produce ATP to power muscle cells to contract. Heart rate and blood oxygen delivery are helpful for getting an idea of an athlete’s efficiency, but they do not tell the whole story for the muscle. At the muscle, the balance between delivery and consumption of oxygen explains its efficiency [1]. To measure muscle oxygen saturation, a technique called near-infrared spectroscopy (NIRS) is used to get real time data to inform athletes of the state of their muscles during training. This is a powerful tool for maximizing athletic gains in muscles from training and to see the state of the muscle over time and after rest.

Early NIRS instrumentation was contained to the lab, but recently portable versions have become more common, which is very important for its use in both the medical and research fields. In medicine, NIR has been used for study of septic shock, free tissue transfer, real-time tissue perfusion during surgery, cancer nanotechnology, and peripheral arterial disease.  For this post, the use of NIR in exercise will be highlighted. In exercise, NIRS is a great tool because it is a non-invasive method that can be applied locally to muscles or tissues of interest and provide real time data during exercise. NIRS is highly sensitive to changes in muscle tissue oxygenation [2, 3, 4], and it reflects the balance between oxygen delivery and utilization, unlike measurements of arterial or venous blood samples which have been used previously and are minimally invasive [2]. NIRS works by measuring the percentage of oxygenated hemoglobin to total hemoglobin (oxygenated and deoxygenated hemoglobin) to give muscle oxygenation. Hemoglobin is the main oxygen carrying protein in the blood and can carry 4 oxygen molecules (O2). Oxygenated and deoxygenated hemoglobin scatter NIR light (600-1000 nm) differently, so their relative concentrations can be found from their molecular absorption coefficients. To do this, three to four different wave lengths of light will be used to determine the concentrations of each based on the change in molecular absorption coefficients at different wavelengths (Fig 1). NIR light must be used as it: 1) passes through skin, bone, and most biological tissue, and 2) is the appropriate wavelength where the small amount of absorption that occurs is predominately from hemoglobin (Fig 2) [5].  As the muscle performs work, the muscle oxygenation will decrease as a function of the work and the training of the muscle.

Fig. 1: Molecular Absorption Coefficient Profiles for Oxygenated and Deoxygenated Hemoglobin [5]

Fig 2: Light Absorption by Wavelength [5]


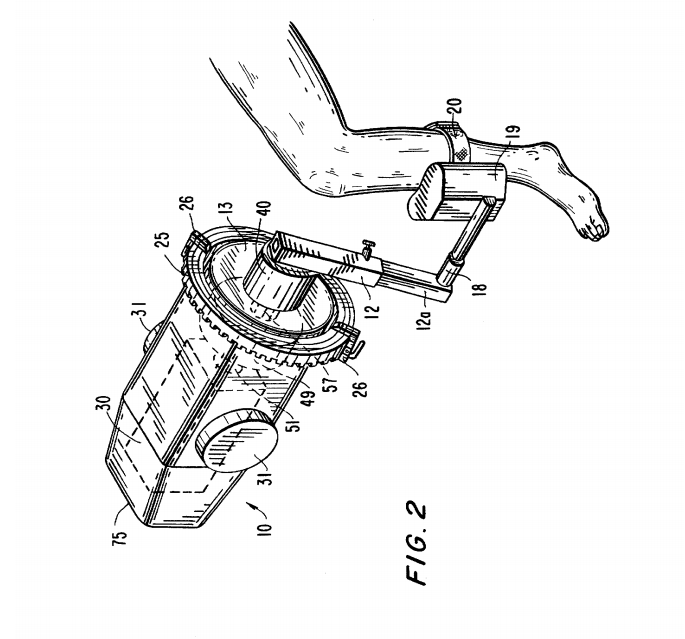
A patent on google patent claims to leverage this technology in a wearable article of clothing for athletes to be able to measure muscle oxygenation real-time (Fig 3) [6]. The patent claims to be a method and apparatus for assessing tissue oxygenation saturation through two main claims that summarize to: a portable apparatus that is a wearable article capable of measuring oxygenation saturation of at least one of a skin dermis layer, adipose layer, or muscular fascial layer of a user during physical activity using at least one near-infrared spectroscopy probe including at least one near-infrared light source and at least one photodetector. In short, the patent is a claim on a portable, wearable NIRS device for tissue oxygenation levels. NIRS has been a research method for decades, so the novel part of this patent lies in the incorporation of this technology into a wearable article of clothing.

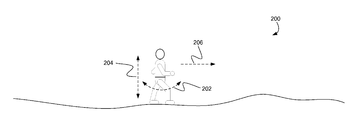
Fig 3: Figure from patent illustrating wearable shirt, shorts, and socks using NIRS

Fig4: Figures from patent showing example data of muscle oxygenation average during constant rate running at different grades (top) and real time data from medial gastrocnemius muscle during weighted exercise and unweighted control (bottom)

This patent pertains primarily to the measurement of tissue during exercise (Fig 4). This could be of use for athletes during training to be able to compare what levels of exercise cause certain levels of muscle oxygen saturation loss. For example, highly trained athletes often train at high altitude to reduce oxygen in the air so that their body adapts to becoming more efficient with oxygen usage. This prompts higher performance when returning to normal oxygen levels. Using NIRS could allow them to find a training regime that caused the same hypoxia in muscle without traveling to higher altitude (they will still miss out on some of the pulmonary and cardio vascular advantages that training at altitude can produce). This may also be helpful in rehabilitation as the change in muscle oxygenation is an indicator that the muscle is being used and can inform physical therapists if the patient is engaging the correct muscles during rehab. Additionally, the device may also have merit in the medical realm for monitor muscle oxygenation in patients with chronic heart failure, peripheral vascular disease, chronic obstructive pulmonary disease, and varying muscle diseases [3, 4].

  1. Patent title: Method and apparatus for assessing tissue oxygenation saturation
  2. Patent number: US20170273609A1
  3. Patent filing date: 2017-03-22
  4. Patent issue date: Patent Pending
  5. How long it took for this patent to issue: TBD
  6. Inventor(s): Luke G. Gutwein, Clinton D. Bahler, Anthony S. Kaleth
  7. Assignee (if applicable): Indiana University Research and Technology Corp
  8. U.S. classification: A61B5/0075
  9. How many claims: 20

References and Further Reading

[1] BSX Athletics https://support.bsxinsight.com/hc/en-us/articles/204468695-What-is-muscle-oxygenation-

[2] Bhambhani, Y. N. (2004). Muscle Oxygenation Trends During Dynamic Exercise Measured by Near Infrared Spectroscopy. Can. J. Appl. Physiol., 29(4), 504–523.

[3] Hamaoka, T., Mccully, K. K., Quarisma, V., Yamamoto, K., & Chance, B. (2007). Near-infrared spectroscopy / imaging for monitoring muscle oxygenation and oxidative metabolism. Jounal of Biomedical Optics, 12(6), 1–16. http://doi.org/10.1117/1.2805437

[4] Boushel, R., & Piantadosi, C. A. (2000). Near-infrared spectroscopy for monitoring muscle oxygenation. Acta Physiol Scand, 168, 615–622. http://doi.org/10.1046/j.1365-201x.2000.00713.x

[5] Shimadzu Commercial Website https://www.ssi.shimadzu.com/products/imaging/labnirs-principle-of-operation.html

[6] Patent https://patents.google.com/patent/US20170273609A1/en?oq=US20170273609A1

[7] Ferrari, M., Muthalib, Makii, & Quarisma, V. (2011). The use of near-infrared spectroscopy in understanding skeletal muscle physiology : Phil. Trans. R. Soc. A, 369, 4577–4590. http://doi.org/10.1098/rsta.2011.0230 

[8] Artinis Commercial Site https://www.artinis.com/portamon#portamon-software

Air Displacement Plethysmography: How It Works Patent Post

Body Fat is an important health statistic. Whether you are a person who dreams of obtaining “rock-hard” abs on the beach, a person aiming to shed a couple of pounds for the new year, a doctor assessing a patient’s risk of cardiac arrest, or just a general fitness enthusiast, body fat is the rave of today’s exercise culture. Although there is a negative connotation associated with body fat, it is an essential nutrient. Fats are needed to boost energy levels and numerous metabolic processes. Generally, a healthy individual is considered to have a body fat value in the range of 18-25%. However, excessive fat levels have shown a positive correlation with mortality.

Historically, body mass index (BMI) has been used more often by doctors to evaluate a person’s overall fitness. But a health study in the American Journal of Clinical Nutrition determined that an individual’s body fat is more effective in assessing his/her risk of developing chronic disease than BMI due to the failure of the latter in differentiating between fat-free mass (bone, water, lean tissue) and the weight of fat mass in the body. An individual may be on the lower end of the obesity spectrum in terms of total weight, but still possess an enormous risk of cardiovascular diseases due to having too much body fat.

Based on these facts, one could argue that healthcare professionals should deviate from the practice of collecting patient’s BMIs and focus their attention solely on calculating patients’ body fat percentage. However, measuring an individual’s  body fat is an arduous process due to the amount of time need to procure data and make calculations, which require a good understanding of topics such as calculus. and conversation of mass (nasty math/physics). For that reason, BMI  is more commonly used despite the lower confidence in this data. Thus, there is a high demand for technology that can assess an individual’s body fat percentage in an accurate and timely manner.

Air Displacement Plethysmography is an emerging technology that utilizes air perturbations that occur when a subject enters a confined space in order to determine their body fat levels. Please click here to view figures collected from a US patent filed for the BodPod: an air plethysmographic apparatus manufactured by Life Measurements Instruments, a medical device company based in Concord, California.

The Bod Pod consists of an air circulation system (represented by item 60 on figure 2) linked to a plethysmographic measurement chamber (pointed out by item  50 on figure 2). The air circulation system (embodied in greater detail by  Fig 3 of the patent), comprised of one or more pumps, acts as both a source of circulation and filtration within the chamber by using ambient air (air that is derived from a temperature-enclosed environment). Clean air is pumped into the chamber via an inlet tube (represented by item  86) while contaminated air is moved out of the chamber through an outlet tube (represented by item 88), where it is later filtered and recycled. The result is a clean and controlled air environment that is maintained throughout the duration of the BodPod’s operation. Inside of the Bod Pod are plethysmographic measurement components(represented by item 56 and 58 on Figure 2) that record perturbations in the volume of air inside the chamber before and after a subject enters in order to calculate the subject’s body volume by subtraction. For those who aren’t familiar, a plethysmograph is an instrument that measures displacements in a fluid within an enclosed environment (in this case, the BodPod chamber). In order to gather accurate data, it is imperative that the volume of air in the chamber is recorded before a subject enters the chamber. Once all data has been collected, it is wirelessly  transmitted to a computer for further analysis using software provided by Life Instruments. Once the subject’s body volume has been determined, it is immediately inserted into Siri’s Equation to calculate the subject’s body fat percentage.


References

Dempster Phillip, Michael Homer, and Mark Lowe (2004). United States Patent 20040193074 A1. Retrieved from https://patentimages.storage.googleapis.com/93/cf/ea/6d2d1346ea1129/US20040193074A1.pdf


How to Quantify “Getting Back in the Game”

Sports injuries are a major roadblock for athletes, keeping them from playing their best, or even at all. Even after an injury is healed, athletes have to build back up muscles that atrophied over recovery time.  During rehab time, patients undergo different exercise routines to build the muscle that was left unused while the injury was healing. But how do the trainers know when it is safe to allow the athlete back in the field?

One way to quantify the “readiness” of the player is by using an Isokinetic Dynamometer machine to determine how much power the questioned muscle can exert and how that compares to its counterpart.  For example, let’s say a female athlete tears her right ACL. Throughout her rehabilitation, her trainers will set her up on an Isokinetic Dynamometer machine (Figure 1) to determine the power exerted by the right quadricep and hamstring, which are muscles that commonly experience atrophy during ACL recovery, and compare it to the power of her left quadricep and hamstring. Based on the presettings of range of motion, force, and speed, the device can calculate the torque provided by the athlete and then multiply it by the constant speed (isokinetic part) to find the power exerted by those specific muscles. It is obvious that time is needed to heal, but every patient is unique and time could vary. It is important to find a quantitative way to determine when each patient is back to normal strength and this design does just that.

One patent of an isokinetic dynamometer is the “Exercise Physical Rehabilitation and Testing Method and Apparatus” (Patent number: 5,722,937), which was filed in April 17, 1996 and issued on March 3, 1998.  Invented by James F. Smith, it is still used by assignee Cybex International, Inc to this day.  U.S. classifications are as followed: 601/23; 601/24; 482/4; 482/137; 482/142; 482/908.

Figure 1: Set-up of limb to lever arm and dynamometer. The user pushes leg up and back and the dynamometer, comprised of the motor and cycloidal speed reducer, monitors and alerts the computer if the motor needs to slow down or speed up to keep a constant speed depending on the torque exerted by the user.

The main claims of a total 30 for this patent is to help athletes and patients in rehabilitation for muscle atrophy or decreased muscle strength by evaluating the strength of a targeted muscle by forcing the patient to keep a constant speed through resistance. This machine consists of a base with a track to allow adjustability of the chair to customize the fit for each user. There is also a lever arm, where the user will push against during exercises, connected to the chair and to the dynamometer. The dynamometer is comprised of a motor to change torque and a cycloidal speed reducer with a high and low speed shaft to keep a constant speed during exercise (Figure 1).  This machine helps build muscle fibers by forcing the patient/athlete to provide maximum force to move a lever arm while the machine provides resistance (or takes away) to keep the patient moving at a constant speed. Not only can this machine provide biofeedback on the power of the muscle to help physical therapists plan an exercise regimen to help patients, but it can also help athletes build their muscles and ensure their body is balanced to avoid straining and injury. This device has various protocols that subjects the muscles of the user to “concentric or eccentric motion in isotonic or isokinetic modes or continuous passive motion.”

Physical Therapists, Athletic Trainers and athletes will primarily use this machine.  It is very bulky and expensive, so only established facilities can afford this technology.  This product helps physical therapists and athletic trainers assess the muscle strength of their patients to determine what the state of the targeted muscle strength is and help them prepare an exercise routine to get their patients to where they need to be to be healthy and avoid further injury. Athletes can also use this technology to grow muscles due to the max force and full range of motion the lever and program provide.  This product is designed for determining when muscles have developed enough to start playing again after suffering from atrophy during rehabilitation.

Figure 2: Schematic of Isokinetic Concentric mode feedback loop depending on the performance of the user.  If threshold torque is too high, the motor will accelerate. If threshold torque is too low, motor will decelerate to zero speed.

Patients sit in an upright position and strapped at the waist and thigh to stabilize the body and to force the patient to only use the targeted muscle. Next, after setting up the machine with the desired weight and speed, the patient must push and pull a lever arm as hard as they can.  The lever arm, attached to a low speed shaft of a cycloidal speed reducer follows a negative feedback and the machine. For example, Isokinetic Concentric mode, the mode most commonly used for determining the power produced by the muscle, uses the dynamometer control board to determine the angle (boundaries of range of motion) of the lever arm and signals the dynamometer to slow down to a stop until the user pushes the lever arm in the other direction. The torque on the dynamometer control board, which is measured by strain gauges, is sampled every two milliseconds.  The computer monitors the the measured torque (force of the limb attached to the lever arm multiplied by the distance to the targeted muscle) and compares it to the threshold torque. If the measured is greater than the threshold, the motor will accelerate (less resistance) based on the magnitude of the torque and the direction of the measured torque to approach the isokinetic speed. If the measured torque is not sufficient, the motor will decelerate to zero speed until sufficient torque is met (Figure 2).

Compared to other designs, this patent is less costly, smaller in size, and has less parts. Also, the speed reducer incorporated in this design does not create a high pitch noise that is  disruptive in quiet clinical scenes, which was commonly found in previous designs. As for the infrastructure of the machine, this new design fixes a previous problem of slack resistance during start up, which creates a loose and not smooth feeling for patients (also known as backlash). The slack would allow for additional bending torque on the shafts, which creates that loose and unnatural feel. This design fixes this problem because the cycloidal speed reducer specific to this design has a higher torsional stiffness. The cycloidal speed reduces also has a longer life and will reduce the overall effect of backlash throughout time. This patent is still the primary patent for CSMi Medical Solution’s HumacNorm Testing and Rehabilitation System, so it is reasonable to assume these claims are valid and the design is reliable and effective!


Source:

Smith, J.F. (1998). U.S. Patent No. 5,722,937. Retrieved from http://pdfpiw.uspto.gov/.piw?PageNum=0&docid=05722937&IDKey=C45CA52352DA%0D%0A&HomeUrl=http%3A%2F%2Fpatft.uspto.gov%2Fnetacgi%2Fnph-Parser%3FSect1%3DPTO1%2526Sect2%3DHITOFF%2526d%3DPALL%2526p%3D1%2526u%3D%25252Fnetahtml%25252FPTO%25252Fsrchnum.htm%2526r%3D1%2526f%3DG%2526l%3D50%2526s1%3D5%2C722%2C937.PN.%2526OS%3DPN%2F5%2C722%2C937%2526RS%3DPN%2F5%2C722%2C937


Body Composition Testing for All

Patent Number: US 6,631,292 B1

Filing Date: March 23, 2001

Issue Date: October 7, 2003

Inventor(s):  Rudolph J. Liedtke (Grosse Pointe Park, MI)

Assignee: RJL Systems, Inc. (Mt. Clemens, MI)

U.S. Classification: 600/547

Claims: 20


Figure 1. A functional block diagram of a single aspect of a device based on the invention


A bioelectrical impedance analyzer is an apparatus used to determine bioelectrical impedance measurements. This particular analyzer is used to measure a particular area of impedance in a subject. This works by having a constant source of current where the currents input is controlled by a feedback loop. This feedback loop uses an error signal that represents the difference between the actual impedance of the area measured, the target current. The analyzer also contains an impedance measuring circuit that detects and output voltage from the area of the subject. This circuit splits the measured output voltage into a reactance output signal and a resistance output signal. The image above shows a block diagram of the electrical components within this analyzer.

Bioelectrical impedance analyzers can be used to find measurements within the human body. These measurements    can then be used to determine many different things about the body being tested. Using these measurements, blood flow, cardiac output, lean body mass, and body fat can be found for the tested individual. This invention of the bioelectrical impedance analyzer differs from those before it because it separates the electrical components of the analyzer from the individual using it. This is different from previous designs that directly attached electrodes to the individual. Another difference in this invention its temperature insensitivity. This allows the analyzer to be easily portable compared to its related technologies.

This analyzer invention had 20 claims outlining the main components of this device. These claims all referred to the electrical components of the analyzer. The main claims of this invention are that the constant current sources input current is controlled by an internal feedback loop that uses error signals to calculate an output. Another main claim is that the impedance measuring circuit is made to give out both a reactance and a resistance output signal.

This particular bioelectrical impedance analyzer invention would be ideal for any individual who is concerned about their body composition. It is easily portable and safe to use. For example, an individual who is looking to cut body fat, but doesn’t want to pay for the expensive body fat testing, would benefit from this analyzer. This analyzer would also be good for people who are body builders that travel often. This way they would have a way to test their body composition so that they could stay on track with their goals. Having had personal experience using a portable bioelectrical impedance analyzer, I think this would be ideal for someone wanting a close estimate on different body composition measurements. Even though the measurements aren’t as accurate as some other more expensive and invasive techniques, these portable analyzers work great and are more easily accessible. It is interesting to think about how this analyzer will advance and become more accurate in the future.

Reference

Liedtke, Rudolph J. (2003). United States Patent No. US6,631,292B1. Retrieved

from https://patents.google.com/patent/US6631292B1/en

Tired of Blood Tests? Don’t Sweat it! (Or do, I Suppose)

I think I stand with the majority of the population when I say that I do not like needles. Blood work, as I’m sure you can imagine, is not really my cup of tea. As I sit there in that dreadfully uninviting chair with a rubber tourniquet tied way-too-tightly-for-comfort around my upper arm, I find myself wishing there was a less invasive alternative, ideally one that doesn’t leave me with a puncture wound. Well, luckily for me and any other sane individual who shares my distaste for needles, the future looks bright. Sweat has historically been overlooked as a biosensing platform despite carrying many of the same biomarkers, chemicals, and solutes that are carried in blood. This stems from a variety of different complications associated with sweat sensing that simply don’t exist for blood tests, and these complications have been enough to prevent any significant progress in the field for a long time. It was not until a group of scientists from the University of Cincinnati were issued an intriguing patent on January 22nd of this year that the field of sweat sensing technology began to see hope.

Now all of that is a bit dramatic, but let’s be real. How many of you would have kept reading if I started off with “Devices for integrated, repeated, prolonged, and/or reliable sweat stimulation and biosensing” (the official name for the patent in question)? I’m sure sweat stimulation isn’t something you planned on spending a great deal of time thinking about today, but you’re here now and boy let me tell you, this is exciting stuff. US patent number 10182795 could have some major implications in the near future across multiple facets of life. Inventors Jason Heikenfeld and Zachary Cole, working out of the assignee of the patent, the University of Cincinnati, have put forth some novel approaches to addressing the complications associated with sweat biosensing, specifically the inability to consistently gather enough sweat from one area for testing, skin irritation, and the contamination of sweat samples from chemicals used to stimulate sweating, like pilocarpine. Their patent, filed on October 17, 2014 and classified under CPC A61B 5/1491 (using means for promoting sweat production), among other classifications, describes a medical technology that has potential for a wide-ranging impact, and the many claims they make (13 to be exact) sound promising.

So let’s talk about the invention. At its core, it’s a method of sweat stimulation and sampling through device-skin interface that could be deployed through a variety of different mediums, including patches, bands, straps, clothing, wearables, etc. Utilizing multiple sweat stimulation pads controlled by a timing circuit capable of selectively activating/deactivating individual pads, this technology is able to rotate through the pads over time. This prevents skin irritation caused by the single-pad, continuous sweat stimulation that has been used in this design’s predecessors, and also allows more consistent sweat collection due to the rotation between fresh sweat stores. One commonality between this design and previous sweat sensors is the method of sweat stimulation, but even within that apparent commonality there are improvements that have been made. While this design still plans to use a molecular method of drawing sweat out of the skin, like pilocarpine, it also includes a filtration component, or membrane, to ensure purity of the sweat sample collected. Once collected, the sample is pumped to a sensor by a microfluidic component to analyze the concentration of the analyte of interest for that sensor. The design can be seen in better detail below.

The inventors claim that this device will collect and analyze sweat over extended periods of time through the components and methods described above. If that is in fact true, this technology could soon be in use everywhere. From athletes seeking to maximize their body’s performance to nurses caring for neonates to patients undergoing pharmacological monitoring, this technology could be a real breakthrough in systemic biomarker detection. Why bother with a needle when you can get the same information by slapping a patch on your arm? This patent has the potential to render most blood tests for analytes present in sweat obsolete. There is likely still a long road ahead before it reaches the market, and it may very well end up like the vast majority of US patents that never make it there. But I know I’ll be on the lookout for clinical trials over the next 5-10 years. I hope you will too.

Reference

Heikenfeld, Jason C., Sonner, Zachary Cole. (2019). United States Patent No. 10182795B2. Retrieved from http://pdfpiw.uspto.gov/.piw?PageNum=0&docid=10182795&IDKey=263AB8D65766%0D%0A&HomeUrl=http%3A%2F%2Fpatft.uspto.gov%2Fnetacgi%2Fnph-Parser%3FSect1%3DPTO2%2526Sect2%3DHITOFF%2526p%3D1%2526u%3D%25252Fnetahtml%25252FPTO%25252Fsearch-bool.html%2526r%3D3%2526f%3DG%2526l%3D50%2526co1%3DAND%2526d%3DPTXT%2526s1%3Deccrine%2526s2%3Dsensor%2526OS%3Deccrine%252BAND%252Bsensor%2526RS%3Deccrine%252BAND%252Bsensor

Just Trying To Reach 10,000 Or Competing To Step Above The Rest – How Do Wrist Pedometers Count Our Steps?

People everywhere are getting their steps in. Whether they’re attempting to reach 10,000 steps a day or participating in competitions with friends, family, or coworkers to see who can step the most, people are moving – and they want to know exactly how much. Wrist fitness trackers with built in pedometers have become a popular mode for individuals to track their daily activity, but how do these devices work?

Let’s look at Apple Incorporated’s Wrist Pedometer Step Detection technology. This technology uses motion data to determine a force comparison threshold that can be used to accurately count steps while a user is running and walking.

An illustration of a person using a wrist pedometer for step detection, included in United States Patent No. US20140074431A1


Patent title: Wrist Pedometer Step Detection

Patent number: US20140074431A1

Patent filing date: 2012-09-10

Patent issue date: 2014-03-13

Inventor: Yash Rohit Modi

Assignee: Apple Inc

U.S. classification: G01C22/006 Pedometers

How many claims: 18

Forces acting on a wrist pedometer can be associated with user movement, specifically when they’re walking or running. The force of gravity as well as the forces exerted by the user against the force of gravity are measured by the pedometer; changes in forces acting on the device can be used to determine step count as well as type of exercise. While standing the force detected by the pedometer is 1G (one times the force of gravity). When a user is pushing against the ground to step forward the force detected by the pedometer can rise above 1G, and while the user is between steps the force detected by the pedometer can go below 1G. The pedometer can detect when a user takes a step by monitoring forces and determining when the 1G threshold is crossed.

Forces are compared based off magnitude and frequency to accurately count user steps. Other pedometer technologies worn at the trunk have used a 0.2G comparison threshold to account for steps, meaning when the pedometer experiences a for change of at least 0.2G one step will be added onto the step count. This threshold has been set to prevent noise and standing movements from being accounted for in step count.  However, the force differential experienced by wrist pedometers change with alternating steps. With the step on the side opposing the pedometer, the force acting on the pedometer is often less than 0.2G and may not be detected by the device with this threshold in place. To overcome this issue, this devices step algorithm has included frequency of threshold crossing to account for opposing steps. If the comparison threshold has been crossed twice over a set step time, then the technology will account for two steps rather than one. This prevents the technology from missing steps – thus, increasing device accuracy.

Motion data is also utilized in this technology to account for user activity and adjust parameters appropriately count steps . Fast Fourier Transform (FFT) is used to determine dominant frequency of motion and determine user activity. If the dominant frequency is below run threshold, then steps are counted for within walking parameters, described above. If the dominant frequency is above run threshold, then steps are counted for within running parameters. While running, there is a reduction in change of force acting on the pedometer; the change of parameters takes this into account and utilizes this information to properly account for steps.

Unlike other step counting technologies on the market, this product has improved accuracy in step count. The step counting algorithm has parameters that better define noise and non-walking movement as well as a mode to account for the imbalance in force acting on the wrist pedometer during walking. Less steps are unaccounted for and less random movements are counted – making for more accurate step counts.

There are a number of pedometer technologies that exist on the market today. Regardless of brand and step counting algorithm – these technologies are giving indiviudals the ability to count their steps and measure their fitness levels, promoting an active lifestyle for those who utilize them.

Reference

Modi, Yash Rohit. (2014). United States Patent No. US20140074431A1. Retrieved from https://patents.google.com/patent/US20140074431A1/en

A Closer Look At: Cupping

Among Olympic athletes you may have noticed something different in recent years – spots. Big red spots. Elite athletes from a variety of different sports have been spotted with – well- spots. But where are these markings coming from?

Michael Phelps, Alex Naddour, and Natalie Coughlin are a few of many athletes who have utilized cupping, an ancient therapeutic technique that has given them their spots.

Michael Phelps, male US swimmer, 2016 Rio Olympics

Cupping is a practice used in traditional medicine in which suction is created using a glass, bamboo, plastic, or ceramic cup. Negative pressure is generated within the cup and used to lift the skin and surrounding tissues. There are over ten different types of cupping therapy, each utilized to treat a variety of ailments. Most broadly cupping can be categorized in to wet cupping, where incisions are made on an indiviudal prior to applying negative pressure via cup, and dry cupping, where no incisions are made. However, treatments can be further classified by their power of suction, method of suction, and material inside the cup [1].

Since 3500 BC cupping has been practiced across several cultures. The earliest references to cupping therapy are found in the Ebers Papyrus, one of the oldest and most important medical papyri of ancient Egypt dating back 1550 BC. However, this form of therapy has not just been exclusively used by the Egyptians, rather it has been used across many cultures for thousands of years. In ancient Macedonia, cupping therapy was used to treat diseases and health disorders. Ancient Arab practitioners utilized cupping therapy to treat hypertension, polycythemia, headache and migraine, and drug intoxication. Hippocrates advocated cupping therapy as a treatment for many ailments in his treatise Guide to Clinical Treatment. Greek and Roman practitioners regularly used wet and dry cupping to treat a variety of diseases. To this day, Cupping therapy acts as one of the cornerstones of traditional Chinese medicine [2].

Today, athletes utilize cupping to decrease recovery time between training sessions, improve range of motion, alleviate inflammation, and reduce pain [3,4,5].

Research suggests that cupping may alleviate pain in individuals. A 2012 pilot study was conducted to assess the effects of a single wet cupping session on pain. Fifty individuals suffering from non-specific chronic neck pain were selected to receive a single wet cupping therapy session. Relative pain levels were measured through participant questioners and mechanical sensory and pain threshold values. Measures taken directly before therapy sessions and three days after treatment and were compared to assess changes in pain levels. Participants reported a statistically significant reduction in pain three days after treatment; however, because measures in reduction of pain are directly correlated with patient reporting, findings may be based on placebo effect or patient bias making it difficult to draw significant conclusions from this study [6].

Several systematic reviews (SR) assessing the impact of cupping on pain relief suggest there may be a positive correlation between the treatment and pain reduction. Several published randomized clinical trials including cupping interventions have been associated with a reduction in pain; however, these studies are limited by size and potential bias, and share a poor study design. Many studies are limited in longevity, participant sample size, and lack of a sufficient placebo for cupping therapy making it difficult to draw significant conclusions regarding the impact of cupping on pain relief [7,8,9,10].

Little is known about the mechanism of action of cupping. Several theories look to explain the pain relief experienced by individuals, including the following two:

  • The Pain Gate Theory: Chronic pain is influenced by altering pain signaling at the nociceptor level. Through stimulating pain via cupping, the frequency of nociceptor impulses will be increased, leading to the closure of pain gates and inevitably pain reduction.
  • Diffuse Noxious Inhibitory Controls: “Cupping therapy may produce an analgesic effect via nerves that are sensitive to mechanical stimulation. This mechanism is similar to acupuncture in that it activates A∂ and C nerve fibers which are linked to the DNICs system, a pain modulation pathway which has been described as ‘pain inhibits pain’ phenomenon”[9]

The potential mechanisms by which cupping may alleviate pain are not well understood, and certainly require validation by scientific studies. However, in addition to participant pain relief, reported effects of cupping also include increased blood flow to the skin [11] and a reduction in inflammation [12]. These physiological impacts may also influence pain relief experienced in clinical trial participants; however, further research is required to draw any conclusions about the mechanisms by which cupping works to potentially reduce pain.

Although it is difficult to draw significant conclusions relating cupping therapy with pain relief, research study participants, athletes, and thousands of other people claim cupping has helped reduce their pain. Cupping has been practiced for over 5000 years across a number of cultures and has alleviated the pain of many. It’s long history of helping indiviudals enduring pain and illness gives it promise as an effective treatment method. Bottom line- whether it directly facilitates pain relief or acts as a placebo – cupping has helped alleviate pain for thousands of years and can be beneficial.

Questions to consider

  • Cupping therapy – placebo or effective? Does it matter?
  • Measures of patient pain have been qualitative in many clinical trials, is an effective way to evaluate the impact of treatment? Are there any other ways to measure pain that may be more effective?
  • Recently cupping has become more commonly seen in popular culture – featured in films such as The Karate Kid and The Gua Sha Treatment and publicly displaced on the bodies of Olympic athletes: what impact does the integration of this traditional treatment in popular culture have on public perception?

References

[1] Aboushanab, T.S., AlSanad, S. (2018). Cupping Therapy: An Overview from a Modern Medicine Perspective. Journal of Acupuncture and Meridian Studies, 11(3), 83-87.

[2] Qureshi, N. A., Ali, G. I., Abushanab, T. S., El-Olemy, A. T., Alqaed, M. S., El-Subai, I. S., & Al-Bedah, A. M. (2017). History of cupping ( Hijama ): A narrative review of literature. Journal of Integrative Medicine,15(3), 172-181. doi:10.1016/s2095-4964(17)60339-x

[3]How Cupping Therapy Benefits Athletes. (2018, August 31). Retrieved from https://www.communityacupuncture.org/2018/05/01/how-cupping-therapy-benefits-athletes

[4] Is cupping therapy effective among athletes?. (2018, January 13). Retrieved from https://medicalxpress.com/news/2018-02-cupping-therapy-effective-athletes.html

[5] What is Cupping Therapy? (Or Why Do Athletes Have Red Spots?). (2019, January 29). Retrieved from https://wellnessmama.com/129773/cupping-therapy/

[6] Lauche, R., Cramer, H.,Hohmann, C., Choi, K.E., Rampp, T., Saha, F.J, Musial, F., Langhorst, J., Dobos, G. (2011). The Effect of Traditional Cupping on Pain and Mechanical Thresholds in Patients with Chronic Nonspecific Neck Pain: A Randomised Controlled Pilot Study. Evidence-Based Complementary and Alternative Medicine, 2012. doi:10.1155/2012/429718

[7] Kim, J.I., Lee, M.S., Lee, D.H., Boddy, K, Ernst, E. (2011) Cupping for Treating Pain: A Systematic Review. Evidence-Based Complementary and Alternative Medicine, 2012.

[8] Kwon, Y.D., Cho, H.J. (2007). Systematic Review of Cupping Including Bloodclotting Therapy for Musculoskeletal Diseases in Korea. Korean Journal of Oriental Physiology and Pathology, 21(3), 789-793.

[9]Al-Bedah, A.M.N., Ibrahim, S.E., Qureshi, N.A., Aboushanab, T.A., Ali, G.I.M., El-Olemy, A.T., Khalil, A.A.H, Khalil, M.K.M., Alqaed, M.S. (2018). The medical perspective of cupping therapy: Effects and mechanisms of action. Journal of Traditional and Complement Medicine, 1-8.

[10] Mehta, P., Dhapte, V. (2015) Cupping therapy: A prudent remedy for a plethora of medical ailments. Journal of Traditional and Complementary Medicine, 5(3), 127-134. 

[11] Liu, W., Piao, S.A., Meng, X.W., Wei, L.H. (2013). Effects of cupping on blood flow under skin of back in healthy human. World Journal of Acupuncture, 23(3), 50-52.

[12] Lin, M.L., Lin, C.W., Hsieh, Y.A., Wu, H.C.,Shih, Y.S., Su, C.T., Chiu, I.T., Wu, J.H. (2014). Evaluating the effectiveness of low level laser and cupping on low back pain by checking the plasma cortisol level. 2014 IEEE International Symposium on Bioelectronics and Bioinformatics.

Patent Blog Post: Fitbit’s Wearable Heart Rate Monitor

Perhaps you’ve been barraged by emails from Fitbit that try and get you to buy one of their products during one of their many sales. Perhaps you’re a trendy techie and have a wearable in the form of a Galaxy or Apple Watch. Or perhaps you’re simply the owner of a smartphone made within the past few years. All these technologies have heart rate monitoring built into them from the get-go, and it is increasingly hard to get away from gadgets that don’t have some form of heart monitoring. With how ubiquitous the technology has gotten, I would like to look today at one of the patents put forward by Fitbit, one of the more popular brands when it comes to wearable fitness trackers. For this post, I’ll be using the information put forward by Google Patents, seen here.

One of the many figures in the patent, detailing the backside of the wearable.

The patent is simply titled as, “Wearable heart rate monitor,” and has a patent number of US8945017B2. It was originally filed on June 3rd, 2014, and was then approved on February 3rd, 2015. This makes the time to issue a little under a year, which is quite fast for an electronics product. The two inventors credited in the patent are Subramaniam Venkatraman and Shelten Gee Jao Yuen. Looking at the other patents associated with them, Venkatraman seems to have worked on more navigational devices, while Jao Yuen has worked on several other gyroscope-related projects. The assignee is, of course, Fitbit Inc. themselves. Officially, one of the classifications of the patent is, “signal processing specially adapted for physiological signals or for diagnostic purposes for noise prevention, reduction or removal.” This one patent has 30 different claims to its name.

Of the 30 different claims in the patent, many of them tie into 2 main claims. The first is that the wearable heart monitor has a way to efficiently, accurately, and quickly determine the heart rate of the user. The second is to ensure that the wearable is capable of compiling the heart rate monitor’s data, including the heart rate data. This patent is aimed at both casual and advanced fitness enthusiasts, as the data gleaned from the wearable is handy to track. Runners, in particular, would find this tempting as it also mentions step tracking and other forms of movement.

The heart rate monitor works by using a waveform sensor, which reads signals at the surface of the skin. These signals are sent to the rest of the device, where the data is processed. The raw data from the sensor is rough and has a lot of noise from several factors, including movement and moisture. To remove the noise, the data has to be passed through several filters. From that data, a heart rate can be determined, and then presented to the user. Unlike the monitors of prior ages, this heart rate monitor would not rely upon disposable components, instead simply being able to be used multiple times by wearing it. In addition, the heart rate tracker would track more than just heart rate, including details about steps.

References:

Venkatraman, S., & Yuen, S. G. J. (2014). Wearable heart rate monitor. Retrieved from https://patents.google.com/patent/US8945017B2/en