Solving Heart Rate Data Inaccuracies

Identify

Heart rate monitors are useful for athletes, researchers, and clinicians as a method of assessing fitness and cardiovascular health. Heart rate is a basic measure that clinicians use to monitor patients and typically do so with electrocardiogram (ECG). ECG is not as easy to measure upon movement and often requires larger, non-portable measurement devices. For athletes who seek to measure heart rate during exercise, these heart rate monitors are found in the form of a watch or chest strap. Despite its wide-use and high level of reporting, user activity can affect heart rate monitor accuracy. For LED heart rate monitors, where a light is emitted onto the user’s skin as opposed to electrodes that rest on the surface of the skin in ECG, position of the device on the body (Figure 1) and user activity can potentially affect the heart rate data. The issue of erroneous data is especially prevalent for multisport athletes who engage in activities that require different body positions and movements.

Obtaining consistent heart rate data collection and analysis is essential for being able to compare data across activities. For example, an athlete may have a reported average heart rate over a cycling activity as 110bpm and 140bpm during a running activity. Is this difference is due to different intensities for each activity or is it due to inconsistencies in data collection due to different noise factors dependent on activity?

Being able to identify characteristic noise frequencies based on user activity and monitor placement can greatly benefit athletes. This will allow users to either change the placement of the device based on their activity or, more favorably, input the activity to the device prior to data collection, allowing the device to prepare different filtering techniques based on expected noise for that particular activity. Applying these filters to the device would enhance heart rate monitor design and better ensure accurate data.

Formulate

Before solving this problem, a basic understanding of heart rate monitors is necessary. LED heart rate monitors emit a green light to the user’s skin. Some of this light is absorbed, and some is reflected back into a receiver within the device. The absorption can be modeled using the Beer-Lambert law, A =  ε𝓁c, where absorbance (A) is equal to absorptivity (ε), beam length (𝓁), and concentration of absorbing species  (c) [4].

The intensity of the light, based on absorbance, is evaluated by a photodiode in the receiver and is transformed into a photoplethysmogram (PPG) signal by the device’s processor. This PPG signal contains cardiac, respiratory, and motion data, as well as noise. Filters act to remove non-cardiac components from the PPG signal [1] – this is where heart rate data error can occur if not enough noise is removed (Figure 2). Since motion is a noise component in the PPG signal, heart rate data can be influenced by monitor position and user activity [2].

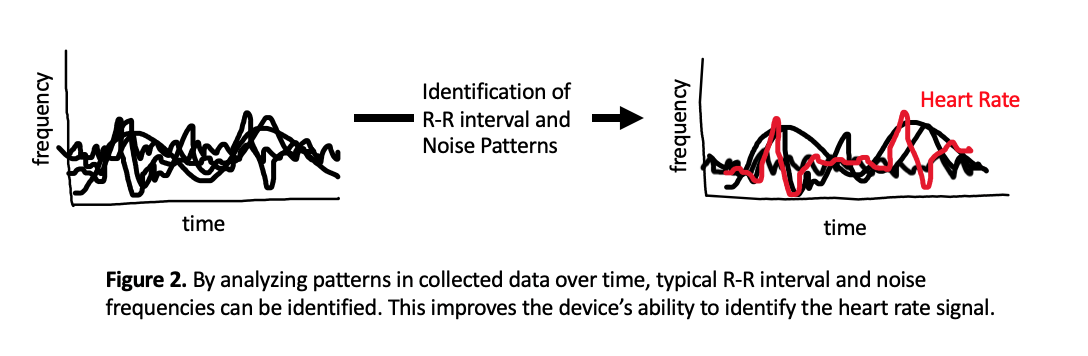
To assess potential discrepancies in heart rate data based on monitor position and user activity, two heart rate monitors can be worn in different locations during various activities (Figure 1). In data collection, it is important to know heart rate data for each of these monitor placements over time at rest and during different activities. It is also important to use a ECG monitor as a reference (i.e a verified, widely-used chest strap) to know what heart rate data should be.

Assumptions made in solving this issue is that light intensity emitted from the heart rate monitor device is consistent throughout an activity, all activities, and between devices. Another assumption is that user intensity for each activity is the same such that heart rate increases are due to monitoring differences rather than increased workout intensity. PPG signal will also be assumed to only have components of cardiac (i.e. heart rate) signals and non-cardiac noise signals. These assumptions allow for heart rate output due to device position and activity to be determined.

Solve

Solving the problem of heart rate monitor outputs varying based on user activity and device position first requires an understanding of which device placements respond to different activities. This data is collected from users wearing monitors in different positions and engaging in different activities. It has been determined that wrist-based measurements respond better to walking and running activities than forearm measurements while forearm measurements respond better to cycling activities than wrist measurements (Figure 3). Both respond well to rest [2].

Next, an analysis of the PPG signal generated for each device placement and each activity can be completed. This allows for the determination of frequencies that are characteristic of noise in each of these activities. For example, since cycling creates more noise in wrist measurements than forearm measurements, the PPG signals of each of these measurements can be compared to determine what is present in the wrist signal that is not present in the forearm signal. This discrepancy, say frequency A, is noise generated in wrist measurements due to cycling motion.

Performing this analysis on a large data set of heart rate measurements over different device placements and user activities allows for the identification of noise frequencies characteristic of certain user activities. In designing a heart rate monitor device, these frequencies can be programmed to be filtered out based on the activity being completed. For example, a user can select “cycling” on their wrist based heart rate monitor prior to beginning exercise and the device will then apply the filter to remove frequency A noise from the data, producing heart rate data just as accurate as a forearm monitor. Designing devices such that noise can be correctly identified and removed will allow multisport athletes to gain reliable heart rate data regardless of activity and without having to move their device on their arm.

This solution is reasonable, however determining exact frequencies characteristic of certain activities would require large data sampling since there is much individual variation in heart rate. Limitations stem from assumptions mentioned above, as user intensity is often not constant across activities and emitted light intensity may change throughout an activity as the device moves closer and farther from the user’s skin due to motion.

References

[1]       P. R. MacDonald and C. J. Kulach, “Heart Rate Monitoring with Time Varying Linear Filtering,” US 9801587 B2, 2017.

[2]       J. Parak and I. Korhonen, “Evaluation of wearable consumer heart rate monitors based on photopletysmography,” 2014 36th Annu. Int. Conf. IEEE Eng. Med. Biol. Soc. EMBC 2014, pp. 3670–3673, 2014, doi: 10.1109/EMBC.2014.6944419.

[3]       J. L. Cheng, J. R. Jeng, and Z. W. Chiang, “Heart rate measurement in the presence of noises,” 2006 Pervasive Heal. Conf. Work. PervasiveHealth, 2006, doi: 10.1109/PCTHEALTH.2006.361651.

[4]       D. F. Swinehart, “The Beer-Lambert law,” J. Chem. Educ., vol. 39, no. 7, pp. 333–335, 1962, doi: 10.1021/ed039p333.


How Garmin Watch Heart Rate Monitors Work

Using a GPS watch has become the norm in distance running. These watches provide users with information regarding distance traveled, pace, and even maps of the route taken. Newer watches also include heart rate monitors, providing users with greater information about their fitness. The popular watch brand, Garmin, has a patented heart rate monitor [1] used in their watches, seen in Figure 1 below. 

Figure 1. Back of Garmin watch with heart rate monitor device (labeled “610”) [1].

The heart rate monitor in Garmin watches monitors cardiac signals via the user’s wrist. The main claims of this invention are as follows:

  • The device consists of an emitter, receiver, inertial sensor, and time-variant sensor. The processor determines frequency associated with the motion signal, transforms the signal from PPG into the frequency domain, identifies the cardiac component of the PPG signal, configures a time-variant filter, and calculates the time between cardiac component cycles.
  • The device emits a light signal and receives an input of the light’s reflection, which eventually allows for the isolation of the cardiac component of signal.
  • The cardiac component of signal allows for heart rate to be determined.
  • The time between successive cycles gives insight into heart rate variability, stress, recovery time, VO2 max, and/or sleep quality.
  • The device contains an interface that displays determined information to the user.

This device would be of interest to any Garmin watch user, especially those interested in heart rate during exercise. This watch, primarily used by runners, tells the user their heart rate and therefore how fast their heart is pumping blood through the body at any given time during exercise. This gives insight into the user’s fitness and exertion levels and ensures the user is in desired heart rate zones while training. Knowing how heart rate changes personally affect the user can also give insight into dehydration, stress, and needed recovery. Using this device over an extended period of time allows for users to see improvements in heart rate due to exercise.

How Does it Work?

The heart rate monitor in Garmin watches directs light from a light-emitting diode (LED) to the skin of the user. The reflection of the light is received by a photodiode, which sends a light intensity signal to the processor. The processor generates a photoplethysmogram (PPG) signal – containing cardiac, motion (determined by an inertial sensor, which senses movement of the device), and respiratory components – based on the intensity of the reflected light.

To isolate the cardiac component of the PPG signal, time-variant filters are used to remove non-cardiac components. The PPG signal can initially be filtered with a bandpass filter that only passes signals within the range of possible cardiac component frequencies. This bandwidth can be adjusted by the processor to account for lesser or greater expected cardiac frequencies based on changes in the environment. For example, if the user begins running, the processor senses rapid motion change and the bandwidth will increase since heart rate is expected to rise.

To determine which other signals to remove within the passband, the processor first identifies one or more frequencies associated with the motion signal via the inertial sensor. The processor then transforms the PPG signal into the frequency domain. Comparing the identified motion signal frequencies with the transformed PPG signal allows for the cardiac component of the signal to be determined within the frequency domain. Then, based on the identified cardiac component, the processor is able to determine filter coefficients for the cardiac component which are configured into the time-variant filter. When the PPG signal is transformed back into the time domain and filtered through this time-variant filter, the motion component is removed from the PPG signal. This results in a time domain PPG signal without the motion component, making it easier to identify the cardiac component of the PPG signal in the time domain. See Figure 2 below for a flowchart describing this filtering process.

Figure 2. Flowchart describing the process of isolating heart rate from PPG signal [1].

The processor does not need to identify frequencies of the motion signal for every time point. It identifies these frequencies within the PPG signal for an initial time period, configures a filter to remove these frequencies, then uses the same filter to filter the motion signal from subsequent time periods of the PPG signal.

The device is also capable of storing memory. This allows for the device to create a model of expected cardiac component frequencies from previously determined data. Based on the model, the processor can then determine the probability of any given frequency within the PPG signal to be a frequency of the cardiac component.

Heartbeat and respiratory patterns are cyclical over a short period of time while motion data and noise can be cyclical or irregular for any length of time. Over a longer period of time, cardiac and respiratory signals can potentially have non-cyclical patterns (e.g. increasing heart rate during an exercise session). This allows for the variability in cardiac parameters to be determined. Analyzing variability in heart rate allows for estimates of parameters of stress, recovery time, VO2 max, and sleep quality.


This patent cites numerous references of inventions this device incorporates or improves upon. This device improves on a previous wrist-watch heart rate monitor (patent 2009/0048526), which was developed as an alternative to wearing a chest strap heart rate monitor. The Garmin device is different from this wrist-watch as this device does not include any inertial sensors. Therefore the Garmin device is able to better remove noise from motion [2]. Another exercise device by Samsung Electronics (patent US 7,867,142 B2) uses heart rate data to inform users about changes in their exercise speed by playing a sound. While the Garmin device does not play a sound, it uses the heart rate data to extrapolate information about stress, recovery time, VO2max, and sleep quality, which is likely to be of greater value to the user [3].

The following lists basic information regarding the Garmin heart rate monitor patent:

  1. Patent title: Heart Rate Monitor With Time Varying Linear Filtering
  2. Patent number: US 9,801,587 B2
  3. Patent filing date: Oct. 18, 2016
  4. Patent issue date: Oct. 31, 2017
  5. How long it took for this patent to issue: 1 year, 13 days
  6. Inventors: Paul R. MacDonald, Christopher J. Kulach
  7. Assignee: Garmin Switzerland GmbH
  8. U.S. classification: CPC: A61B 5/02416 (20130101); A61B 5/1112 (20130101); A61B 5/1118 (20130101); A61B 5/7285 (20130101); A61B 5/721 (20130101); A61B 5/02405 (20130101); A61B 5/02427 (20130101); A61B 5/02438 (20130101); A61B 5/0833 (20130101); A61B 5/486 (20130101); A61B 5/4815 (20130101); A61B 5/681 (20130101); A61B 5/725 (20130101); A61B 5/7278 (20130101); A61B 5/165 (20130101); A61B 2562/0219 (20130101)
  9. How many claims: 29 claims


References:

[1] P. R. MacDonald and C. J. Kulach, “Heart Rate Monitor With Time Varying Linear Filtering.” U.S. Patent 9,801,587 B2, issued October 31, 2017.

[2] R. M. Aarts and M. Ouwerkerk, “Apparatus for Monitoring A Person’s Heart Rate And/Or Heart Variation; Wrist-Watch Comprising The Same.” U.S. Patent 2009/0048526 A1, issued February 19, 2009.

[3] S. K. Kim, J. S. Hwang, and K. H. Kim, “Method and Apparatus for Managing Exercise State of User.” U.S. Patent 7.867,142 B2, issued January 11, 2011.

Dry Needling: Is it Worth the Pain?

Arriving at a physical therapy appointment to have a needle stuck deep into the body’s muscles only to leave hobbling and sorer than before doesn’t seem like an effective method for rehabilitation. However, the post-treatment benefits have made dry needling one of the many techniques individuals are using to treat and prevent injury from exercise.

What is Dry Needling?

While wet needling uses hollow needles to inject corticosteroids into muscle [7], dry needling (DN) consists of inserting a fine needle, similar to those used in acupuncture, deep into the muscle without injections. The needle is then twisted and moved around the area without being fully removed from the skin. The needling itself can be uncomfortable, feeling like a pinch, cramp, or deep prick, and can result in local soreness post-treatment. Physical therapists seek to insert the needle into a myofascial trigger point (MTrP) to relieve myofascial pain syndrome (MPS), the most common muscle pain disorder seen in clinical practice [1]. In exercise science, MTrPs are defined as “hyperirritable local point(s) located in taut bands of skeletal muscle or fascia which when compressed causes local tenderness and referred pain” [10]. Potentially caused by muscle overuse [2], this pain is commonly described as having a knot in a muscle and creates localized tenderness, pain to deep touch, and restricted movement [1].

The video above shows a physical therapist performing the dry needling technique on various muscles. Created by Dynamic Physical Therapy, Covington, LA (2013).

Dry needling is used as a rehabilitation technique to decrease the pain MTrPs can cause. The “fast-in and fast-out needle technique” applies high pressure stimulation to the MTrP, often causing a twitch response. These twitch responses are the result of a spinal reflex generated by the activation of nociceptors and mechanoreceptors. These receptors respond to the painful mechanical irritation and stretch the needle causes within the muscle [1]. When this occurs, a single motor unit fires and a visible, isolated contraction – the “twitch” – can be seen. These twitch responses can occur local to the needle or within muscles on the opposite side of the body. This phenomenon has led researchers to believe that the pain associated with MTrPs is due to central nervous system (CNS) changes [1]. 

How is Dry Needling Portrayed in Healthcare?

Healthcare providers, such as MedStar National Rehabilitation Network and ChristianaCare, have been advocates for dry needling. They mention DN is “an effective physical therapy modality…in the treatment of orthopedic injuries” [5] and that it can even be used for preventing pain and injury [4]. There have been many personal accounts of the wonders of dry needling in recovery from nagging injuries. AshleyJane Kneeland, who struggles with muscular pain due to lupus, fibromyalgia, and postural orthostatic tachycardia syndrome, cites DN treatment as relief for her painful spasms and headaches, as well as providing general relaxation [6]. But how effective is dry needling, really? Is there science to back up these claims?

What Does the Science Say?

Elizabeth A. Tough and co-authors performed a meta-analysis in 2009 of seven studies assessing the effectiveness of DN in managing MTrP pain. This study provides an update for the systematic review by Cummings and White, which found no evidence suggesting injections through wet needling generate a better response than dry needling [3]. One study found by Tough et al. suggests DN is more effective in treating MTrP pain than undergoing no treatment, two studies produced contradictory results when comparing DN in MTrPs to DN elsewhere, and four studies showed DN is more effective than other non-penetrating forms of treatment (placebo controls). However, when combining these studies for a sample size of n=134, no statistical significance was found between DN and placebo treatments. 

While the authors conclude the overall direction of past studies trend towards showing that DN is effective in treating MTrP and MPS [10], there is no significant evidence yet. The lack of statistical significance could be due to low consistency in study design for studies included in the meta-analysis, as each employed varying mechanisms for needle placement, depth, and treatment frequencies, along with there being an overall small sample size. Therefore, further studies are required to significantly conclude that DN is effective in MTrP rehabilitation.

Ortega-Cebrian et al. recognized the limitations in previous studies and thus sought to create a significant evaluation of the ability of DN to decrease pain and improve functional movements. The authors use a myometer (MyotonPro, [8]) and surface electromyography (sEMG) to assess the mechanical properties of muscle in subjects (n=20 M) with quadricep muscle tension and pain [9]. 

The MyotonPro allows researchers to quantify muscle tone and stiffness. While no standards exist for describing these parameters with respect to changes after rehabilitation techniques, researchers found the device to be reliable through inter-rater reliability (comparing values of the MyotonPro to another rater). Pain was assessed by subjects using the Visual Analogue Scale (VAS) and a goniometer was used to measure small range of motion (ROM) improvements. DN was performed by one of two experienced therapists until twitch responses ceased [9].

Authors report that DN resulted in statistically significant pain reduction and an increase in flexion ROM. However, the ROM was very small and could be within the range of measurement error of the goniometer. Also, the p-values reported in-text for these parameters do not match the corresponding table which presents a question of the reliability of author reporting. All sEMG parameters, except for decreased vastus lateralis activity, were not significantly changed by DN, as well as all MyotonPro parameters, besides a decrease in vastus medialis decrement (muscle elasticity) and resistance. In a power analysis performed after the study, authors report needing 198 subjects for statistically significant results – much higher than the 20 subjects used [9]. Therefore this study continues the uncertainty in the benefits of DN, but does present significant subject-reported pain reduction.

Is it Worth the Pain?

So is dry needling worth the pain? After being put to the test through experimental studies, there is no clear evidence that dry needling is more beneficial than alternative rehabilitation methods such as wet needling, placebo needling, or acupuncture [9]. However, while the mechanisms of changes in muscles with trigger points due to dry needling are unknown, subjects do report pain reduction. Dry needling should be taken on a case-by-case basis since current knowledge of widespread benefits is limited. Essentially, if dry needling treatment alleviates pain more than other rehabilitation methods and the pain of the procedure is bearable, why not give it a try?


Questions to Consider:

  • Would you be willing to try dry needling regardless of uncertainties in the literature?
  • Do you believe it is a problem that healthcare providers claim dry needling is effective despite a lack of conclusive evidence?
  • What should future studies do to ensure significant results?


References:

[1] Audette, J. F., Wang, F., & Smith, H. (2004). Bilateral Activation of Motor Unit Potentials with Unilateral Needle Stimulation of Active Myofascial Trigger Points. American Journal of Physical Medicine & Rehabilitation, 83(5), 368–374. doi: 10.1097/01.phm.0000118037.61143.7c. 

[2] Bron, C., & Dommerholt, J. D. (2012). Etiology of Myofascial Trigger Points. Current Pain and Headache Reports, 16(5), 439–444. doi: 10.1007/s11916-012-0289-4. 

[3] Cummings, T., & White, A. R. (2001). Needling therapies in the management of myofascial trigger point pain: A systematic review. Archives of Physical Medicine and Rehabilitation, 82(7), 986–992. doi: 10.1053/apmr.2001.24023. 

[4] Dry Needling®. (n.d.). Retrieved from https://christianacare.org/services/rehabilitation/physicaltherapy/dryneedling/

[5] Dry Needling. (n.d.). Retrieved from https://www.medstarnrh.org/our-services/specialty-services/services/dry-needling/

 [6] Dry Needling: The Most Painful Thing I’ve Ever Loved. (2015, March 25). Retrieved from https://www.everydayhealth.com/columns/my-health-story/dry-needling-most-painful-thing-ever-loved/

[7] Dunning, J., Butts, R., Mourad, F., Young, I., Flannagan, S., & Perreault, T. (2014). Dry needling: a literature review with implications for clinical practice guidelines. Physical Therapy Reviews, 19(4), 252–265. doi: 10.1179/108331913×13844245102034. 

[8] Muscle Tone, Stiffness, Elasticity measurement device. (n.d.). Retrieved from 

 [9] Ortega-Cebrian, S., Luchini, N., & Whiteley, R. (2016). Dry needling: Effects on activation and passive mechanical properties of the quadriceps, pain and range during late stage rehabilitation of ACL reconstructed patients. Physical Therapy in Sport, 21, 57–62. doi: 10.1016/j.ptsp.2016.02.001. 

[10] Tough, E. A., White, A. R., Cummings, T. M., Richards, S. H., & Campbell, J. L. (2009). Acupuncture and dry needling in the management of myofascial trigger point pain: A systematic review and meta-analysis of randomised controlled trials. European Journal of Pain, 13(1), 3–10. doi: 10.1016/j.ejpain.2008.02.006.