
Canvas administrators often hear questions from instructors about how other instructors use their Canvas course sites. Although instructors can use their Canvas site in the ways that best support their students’ learning, we want to share with you data about general Canvas usage.
So far in this academic year (23F, 24W, and 24S through mid-April terms), 6,161 Canvas course sites have been published by instructors for student viewing. Depending on the term, approximately 75-90% of Canvas sites available for student viewing are published by instructors. A Canvas site may represent an individual catalog offering or several catalog offerings if those offerings are combined into a multi-section Canvas site. A course site included in this total has at least one teacher enrolled, one student enrolled, and at at least one page view by a student.
The data below shows in how many of the 6,161 course sites each Canvas tool is used. To be considered in use, a tool must have participations or page views. Page views can be from teachers viewing unpublished content, so this data indicates only that tool has content in a site. It does not necessarily indicate that teachers are providing the content to the students. The Files tool is used in the most course sites followed by the Assignments tool.
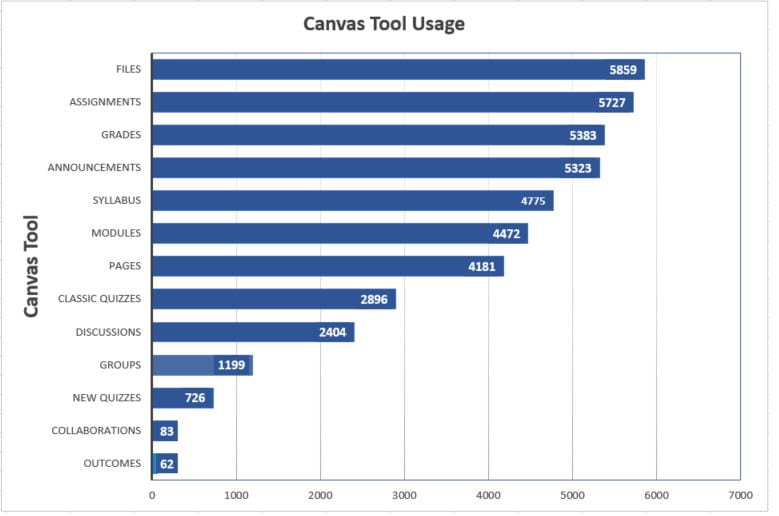
Knowing what types of content instructors use in their Canvas course sites gives administrators an opportunity to dig deeper into usage and ask the right questions to determine why some tools are used or not. It may be that instructors and students find a tool too difficult to use and require more training. There are many possibilities, but starting with some data can determine the questions to ask.
How students participate with the content in Canvas course sites presents another picture. Students can participate in a Canvas site mostly by submitting an assignment, posting a comment to a discussion, or taking a quiz. During the fall and spring terms where enrollment in Canvas sites in the greatest, enrollment averaged 20,750 students. The data below shows the number of participations students made on a monthly basis in the 6,161 sites. As expected, the winter term had less participations because of the smaller enrollment.
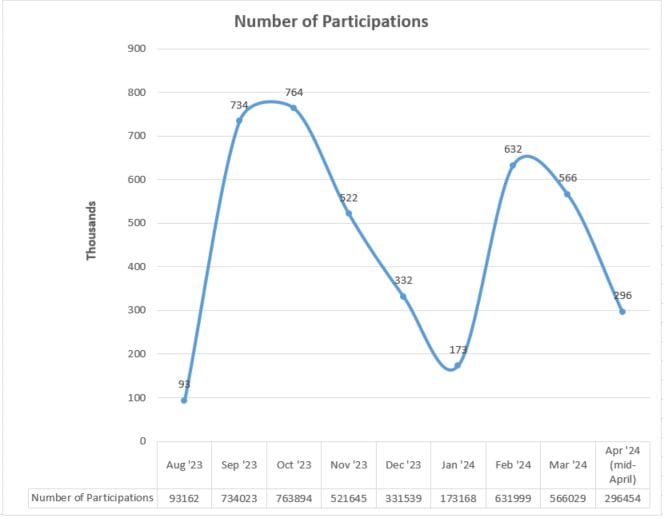
Although not displayed on this chart, the data indicates that students participated just as much in Canvas Assignments as they did in Canvas Classic Quizzes. But the number of assignments in course sites is much greater as shown in the first chart. We might ask if instructors are not using the online assignment type since students could not participate in the increased number available or if instructors create a lot of assignments, but never publish them for students.
Looking at the data provides the first step to asking the appropriate questions to ensure Canvas is used in ways that best support teaching and learning. If you would like to learn more about the data available in your Canvas course site, register for the Canvas Course Analytics Workshop. Check the workshop calendar for upcoming sessions. If you are looking for broader view of data across your courses or would like to explore the Canvas data available for your department, please request a consultation. Data is available regarding student activity, tool use, grading, submission trends and more. If you have additional questions about data in your Canvas course site, please e-mail canvas-info@udel.edu.