Richard Taylor, Extension Agronomist; rtaylor@udel.edu and Phillip Sylvester, Kent Co., Ag Agent; phillip@udel.edu
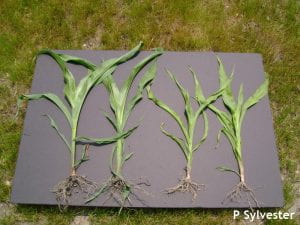
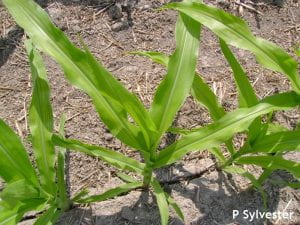
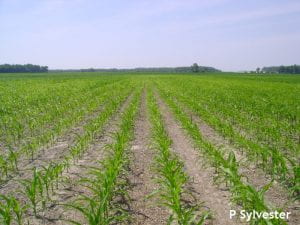
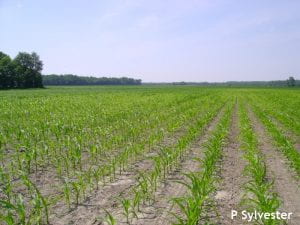
In past articles, we’ve talked about finding manganese (Mn) deficiency in small grains (this spring) and soybeans (last year) but in the past week or two we’ve found the problem in some corn fields as well. Symptoms of Mn deficiency in corn include stunting (Photo 1) and the typical interveinal chlorosis in which the veins remain green and the tissue between veins turns light yellow (Photo 2). Photo 3 and 4 show the field where the deficiency occurred with the good areas in the far distance. It should also be noted that the corn was drought stressed as well.
Photo 1. Manganese deficient corn plants (right) compared with normal corn (left)
Photo 2. Typical interveinal chlorosis caused by manganese deficiency in corn
Photo 3. Field view of Mn deficiency on corn
Photo 4. Field view of Mn deficiency with normal corn in the upper left corner near the woods
For this field, there was a significant difference in the soil organic matter content between the affected areas (2.9%) and the healthier areas (8.9%) (Table 1). Tissue testing of the affected corn plants (Table 2) showed that Mn was deficient while all the other nutrients were either in the sufficient range or higher than the sufficient range. This raised some interesting questions. The good corn soil sample actually contained a lower concentration of manganese than the bad corn soil sample and the soil water pH and percent hydrogen saturation of the soil sample from the good areas showed a greater amount of soil acidity than for the soil sample from the bad areas. The very high organic matter content of the good sample allowed corn growth at the low soil pH (4.9) and the chelating compounds available from the large amount of organic matter helped the plants obtain enough Mn for normal growth. In the lower organic matter areas, Mn availability suffered and was not overcome by the higher level of soil test Mn.
Table 1. Soil Test Results Including (*) Percent Base Saturation for Good and Bad Corn Areas
| Good Corn | Bad Corn | |
| Soil pH 1:1 | 4.9 | 6 |
| Buffer pH | 6.3 | 6.8 |
| Organic Matter % | 8.9 | 2.9 |
| U of D P Sat Ratio | 12 | 32 |
| Mehlich 3 Phosphorus ppm P/FIV | 54 | 126 |
| K ppm | 229 | 161 |
| Ca ppm | 1340 | 1480 |
| Mg ppm | 191 | 191 |
| SO4-S ppm | 41 | 31 |
| Zn ppm | 3.52 | 3.8 |
| Mn ppm | 2 | 4.4 |
| B ppm | 0.98 | 0.98 |
| CEC meq/100 g soil | 16.1 | 11 |
| H* | 45 | 15 |
| K* | 4 | 4 |
| Ca* | 41 | 67 |
| Mg* | 10 | 14 |
| Na* | 0 | 0 |
* Base saturation for each of the cations is given in percent of CEC occupied by that cation.
Table 2. Tissue Sample Results for Manganese Deficient Corn Plants
| Corn Sample | Sufficiency Range | |
| N (%) | 4.25 | |
| P (%) | 0.57 | 0.20-0.50 |
| K (%) | 4.73 | 1.50-3.00 |
| Ca (%) | 0.52 | 0.3-1.20 |
| Mg (%) | 0.29 | 0.15-0.50 |
| S (%) | 0.39 | 0.15-0.40 |
| Mn mg/kg | 16.0 | 25-100 |
| Zn mg/kg | 23.0 | 15-70 |
| Cu mg/kg | 14.9 | 5-25 |
| Fe mg/kg | 110 | NA |
| B mg/kg | 8.0 | NA |
Interpretation of values based on top of the plant.
In the final analysis, the health of the crop returns to both frequent scouting to pick up problems such as this and to emergency foliar application of manganese, either as a chelated Mn or as manganese sulfate. An application of 0.5 to 2 lbs of Mn per acre should support the corn plant until the root system has penetrated deep enough in the soil to reach the more acidic subsoil where Mn availability is likely to be greater. The exact rate depends on the size of the corn plants, the amount of coverage possible with the intended sprayer, the stress level the corn is under at application time, and the willingness of the grower to possibly make a second application if the first application is not sufficient.


