
Nate Bruce, Farm Business Management Specialist, nsbruce@udel.edu
Predicting yields on dryland fields is difficult due to different weather conditions every growing season. Many producers use a simple running five-year yield average to determine what is most likely to occur for both marketing and crop insurance purposes. This is a good risk management strategy but fails to consider the possible scenario of a drought occurrence. USDA National Agricultural Statistics Service (NASS) records average dryland yield data going back to 1977 for each county for corn and soybeans. Statistical modelling of this data will give insight into what yields would look like in a drought scenario. The data for each county was manipulated using regression and analysis of variance (ANOVA) statistical tools to give insight into yield trend and predict what county average yields would be if the worst droughts of the past occurred under modern management today.
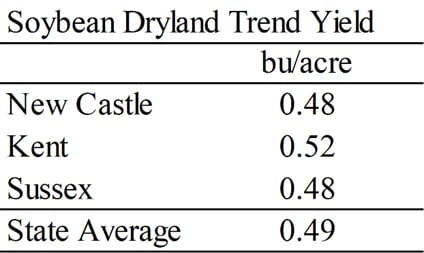
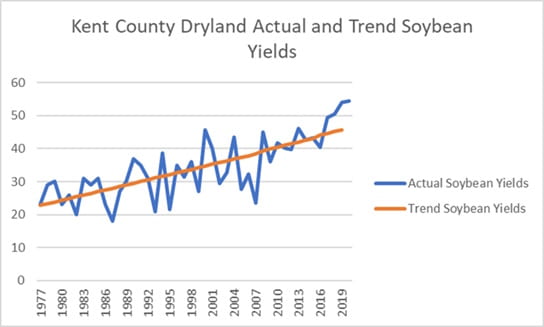
If historical droughts were to occur today, yields would be impacted differently due to improvements in genetics, IPM, and overall management. To project what yields would be if the droughts of the past were to occur today, knowing how these improvements impact yield is important. The trend yield represents the line of best fit for each observed county yield in the NASS county dryland yield datasets. In this case, these results are the year-over-year yield increase attributed to improvements in genetics, IPM, and management in each county. The year-over-year trend yield for corn and soybeans for each county are listed in the tables below. In addition, the observed average county yield values and the trend yield are also plotted for each county.

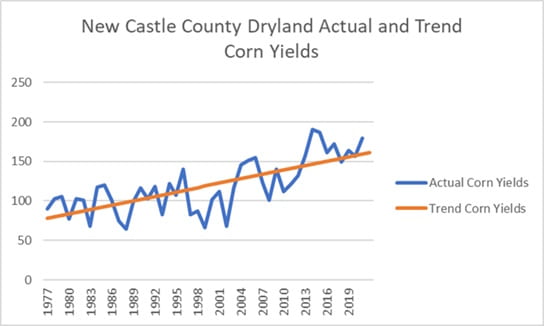

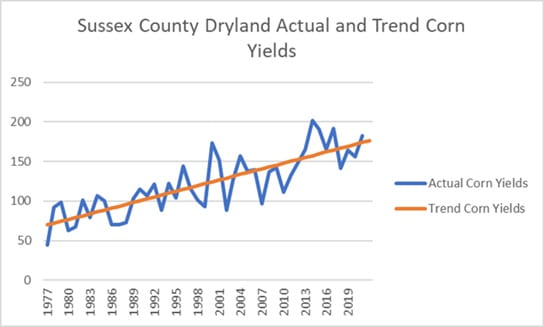
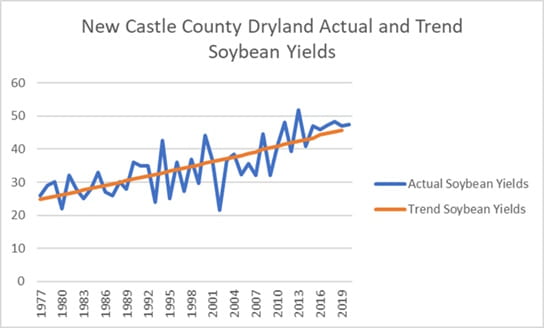

NASS county level dryland yield data shows the past droughts in each county that deviated from trend yield the greatest. For modelling purposes, these are considered the worst droughts in the past for each county and year in Delaware. These droughts will be modelled to determine what yields would look like today under modern management if they were to occur again.
New Castle County
2002 Corn – County Average Yield = 67.7 Bushels / Acre
2002 Soybeans – County Average Yield = 21.5 Bushels / Acre
Kent County
2002 Corn – County Average Yield = 81.1 Bushels / Acre
2007 Soybeans – County Average Yield = 23.6 Bushels / Acre
Sussex County
2002 Corn – County Average Yield = 88.2 Bushels / Acre
1995 Soybeans – County Average Yield = 18 Bushels / Acre
Using the statistical methods mentioned, projected yields that would occur in each county if these droughts of the past occurred today are listed below.
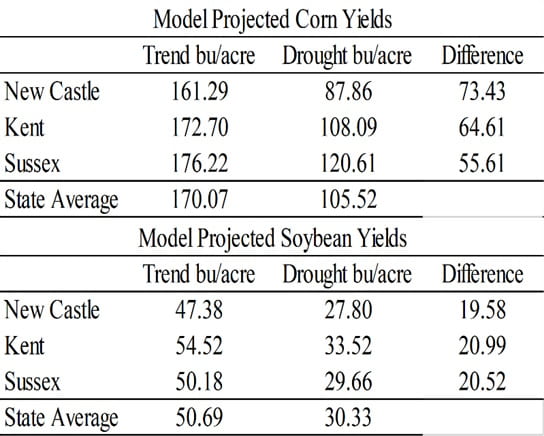
These results can be utilized in several different ways. They can be substituted as potential actual projected yield to evaluate crop insurance decisions. They can also be used as a marketing tool to not oversell or undersell bushels from dryland production. In addition, they can be used in the running five-year yield average producers so often utilize for overall planning purposes.