
Nate Bruce, Farm Business Management Specialist, nsbruce@udel.edu
Mid-term elections are this year and Congress has the potential to change hands with all 435 seats in the House of Representatives and 35 seats in the Senate being contested. Primary elections just recently occurred in Maryland on July 19th, and Delaware’s primary elections are slated for September 13th. When change occurs in Congress, changes may also occur when it comes to creating agricultural policies such as setting ethanol usage demand or enacting policies that impact export and import markets. It is well known that agricultural policies have an impact on grain prices. Below is a graph that shows historical grain prices on the Delmarva peninsula from 1965 to the current day.
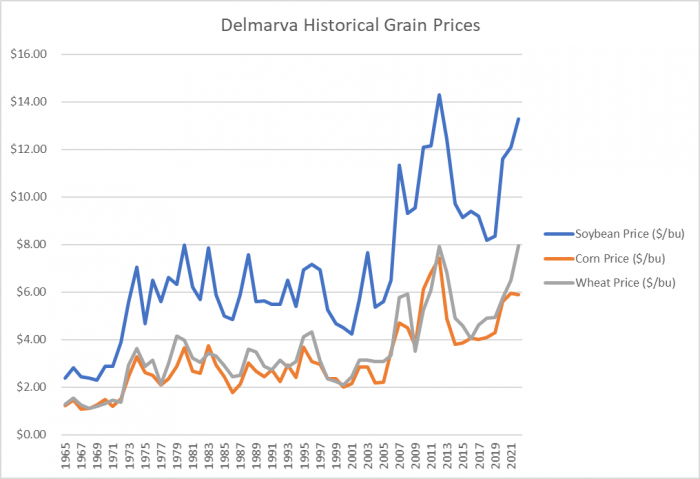
Some long run price changes seen in the historical prices are direct results of agricultural policy changes. Increased export and import demand can be attributed to the increase in grain prices during the early 1970s. Growth in major export markets such as China and increased ethanol usage can be attributed to the grain price increase in 2006. But this leads to the question, how do grain prices change in the short run from year to year during election years and non-election years when politicians are enacting policy? Looking into this question, the annual difference in grain prices going back to 1965 was calculated and averaged for election years (all general election years including presidential elections and mid-terms) and non-election years. The results are interesting and listed below in the following chart.
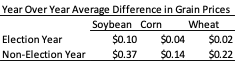
The results show that the annual difference in grain prices during election years are not as significantly high as compared to non-election years. It should be noted that the annual difference in grain prices is not always a positive value. More than often, the annual difference is positive, and the results show this. The annual year over year difference in average grain prices during election years is $0.10 for soybeans, $0.04 for corn, and $0.02 for wheat. In non-election years, the annual year over year difference in average grain prices is $0.37 for soybean, $0.14 for corn, and $0.22 for wheat. This significant annual difference can be attributed to uncertainty surrounding what agricultural policies will be in place due to elections possibly changing which policy makers are active. In non-election years, policies are more established, and there is greater certainty into factors that impact grain prices. There are many factors that influence grain prices and policy changes are significant both in the long run and short run.