
Jarrod O. Miller, Extension Agronomist, jarrod@udel.edu; Cory Whaley, Sussex Co. Extension Ag Agent, whaley@udel.edu; Jake Jones, Extension Agriculture Agent, Kent County, jgjones@udel.edu; Dan Severson, Agriculture Agent, New Castle County, severson@udel.edu
The rainfall this weekend made a big difference across Delmarva, with volumetric soil moisture going increasing rapidly from about 0.10 to 0.30 (Figure 1). New Castle county already had adequate moisture, but Kent and Sussex counties were right on the precipice of a serious drought for all the corn that was already planted. While warmer temperatures and dry conditions helped initial growth, dry soils (without irrigation) have probable reduced growth and stressed plants. Based on accumulated GDD (Table 1), any corn planted in Mid-April should be at V6 and ready to be sidedressed, with other fields right behind. All corn planted mid-May should also be full emerged and into the V1/V2 stages.
| Table 1. Accumulated Growing Degree Days Based on Planting Date | |||
| Planting Date | New Castle | Kent | Sussex |
| 15-Apr | 482 | 513 | 527 |
| 22-Apr | 463 | 486 | 503 |
| 29-Apr | 421 | 437 | 456 |
| 6-May | 309 | 313 | 328 |
| 13-May | 283 | 283 | 290 |
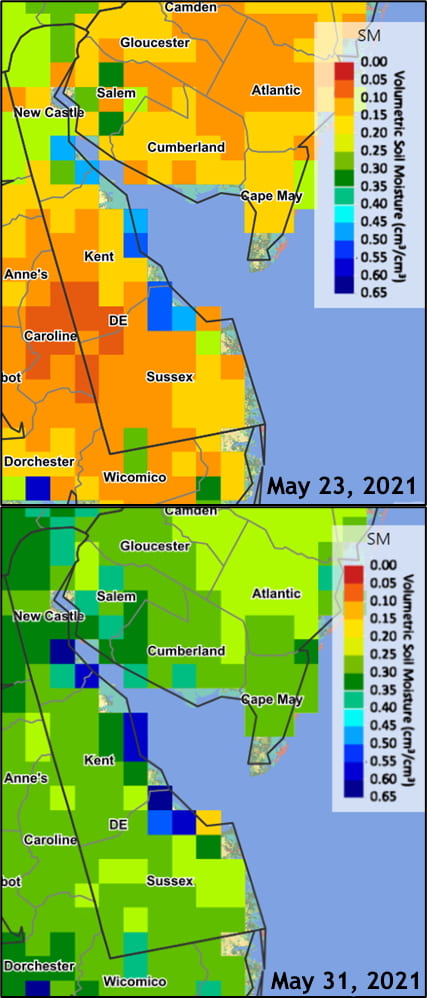
Figure 1. Soil moisture improves significantly after last week’s rainfall (top May 23rd, bottom May 30th)
In Georgetown, the rainfall helped soil moisture (Figure 2b), but cooler temperatures significantly dropped soil temperatures (Figure 2a). In 2020, soil temperatures also had a small cooling effect at the end of May, but 2021 was much more drastic as we set records for low temperatures across the region. Soils are well insulated at this point, so a temperature drop of 10 degrees is significant. While the rainfall was welcome, it has simply brought us just below where we were in 2020. At this point last year we started a very dry stretch. Hopefully rainfall this week will keep it from happening again and bring us back to decent conditions.
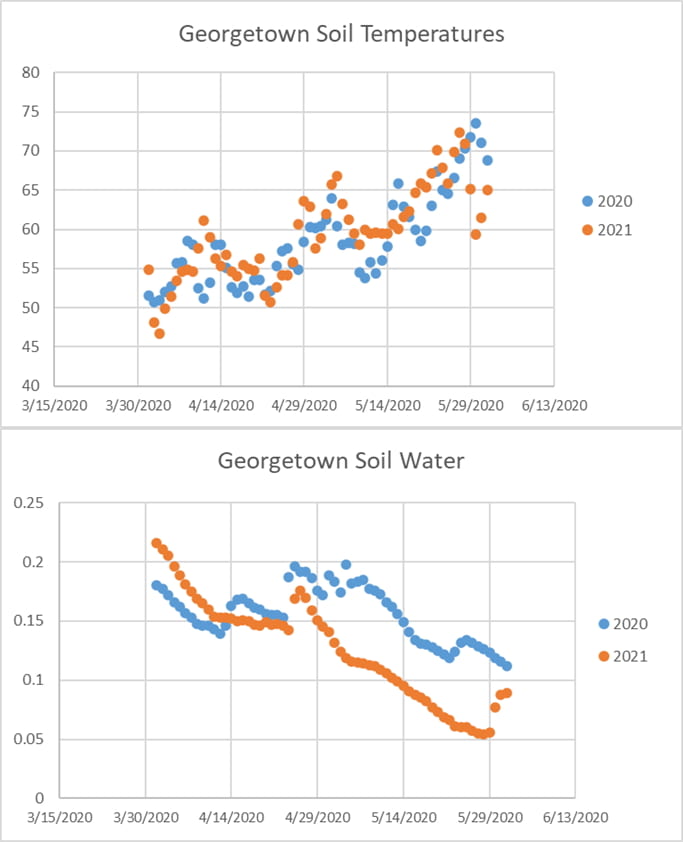
Figure 2. Soil temperatures (a) and soil moisture (b) in Georgetown since April 1st.