
Jarrod O. Miller, Extension Agronomist, jarrod@udel.edu; Cory Whaley, Sussex Co. Extension Ag Agent, whaley@udel.edu; Jake Jones, Extension Agriculture Agent, Kent County, jgjones@udel.edu; Dan Severson, Agriculture Agent, New Castle County, severson@udel.edu
While it may not seem much warmer than it was in 2020, having steady days above 50°F has provided much faster emergence than last year. In 2020 we were getting about 10 growing degree days (GDD) per day, while now we are seeing 15-20. The threshold for emergence is about 100-120 GDD, which we have reached for most fields planted between April 15 and April 22nd (Table 1). In 2020, we had only reached half of that (60-90 statewide) over the same time period.
Table 1: Accumulated Growing Degree Days Based on Planting Date (Emergence = 120)
| County | April 15 | April 22 | April 29 |
| New Castle | 131 | 113 | 70 |
| Kent | 160 | 130 | 82 |
| Sussex | 155 | 132 | 85 |
| 2020 Comparison | |||
| New Castle | 61 | 61 | 58 |
| Kent | 74 | 67 | 63 |
| Sussex | 89 | 88 | 81 |
We have observed corn emerging in 6-7 days for fields planted April 27th at the Carvel Research Center, instead of the typical 10 days this time of year. This sharp increase in temperatures occurred statewide around April 26th (Figure 1). Up until that point, Kent County had been a little warmer than Sussex, but our typical trends are starting to fall out, with Sussex warming up in the last week. There doesn’t look to be a change in the trend over the next week, so expect corn to pop within 6-7 days, and make sure any necessary pre-emergence applications are made.
We have had sparse and smaller rainfall events, so soil moisture has been falling (Figure 3 – through May 3rd). Our topsoil has enough moisture for germination, but keeping checking and make sure your corn doesn’t suffer with these ideal temperature conditions.

Figure 1. Accumulated Growing Degree Days in each County Since April 15th.

Figure 2. Soil temperatures in Georgetown over the last month.
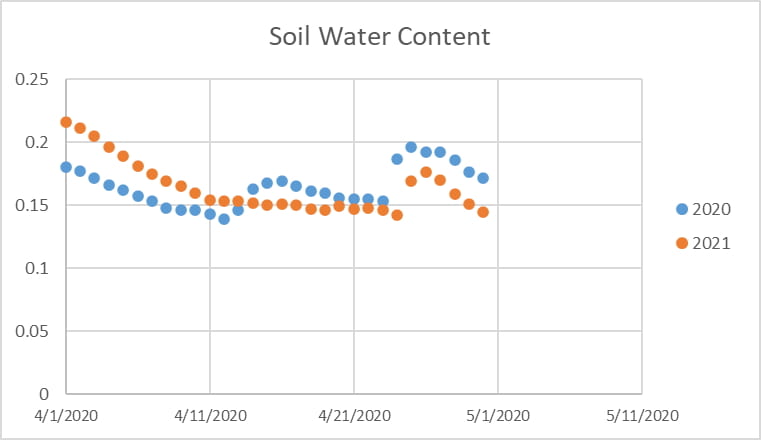
Figure 3. Soil Moisture in Georgetown over the last month.