Jarrod O. Miller, Extension Agronomist, jarrod@udel.edu
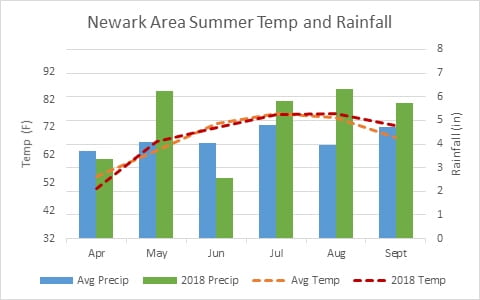
We have enough days in September to get a good average to finish out the season. The graphs below have rainfall (precipitation) as bar graphs, with the typical average in blue and this year’s rainfall in green. Average temperatures are yellow lines and this year’s temperatures are in red.
Newark had a drier June than normal, but most other months have 1-2 inches more rain than normal. Average temperatures in 2018 were warmer in May and throughout September, but were otherwise normal.
Dover had similar summer temperatures to Newark, but received higher than average rainfall every month between May-September. If you went to DEOS (http://www.deos.udel.edu/) after most storms this summer, it was apparent that many storms seemed to move across the center of the state.
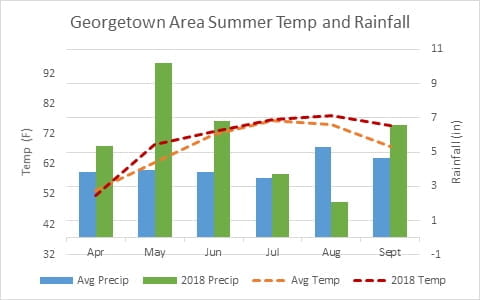
Georgetown was saturated in May, with 10.23 inches of rain compared to the normal of 4 inches. Through the summer, rainfall steadily fell until going far below normal in August with only 2 inches. Temperatures were not so kind in the southern half of the state, with both May and late summer having higher averages. Hopefully farmers in Sussex County kept the irrigation going in August. The rains have returned in September, delaying some of the corn harvest.