November 3, 2023 / Jarrod Miller / Comments Off on Corn planting timing effects on yield and the relationship to deer feeding
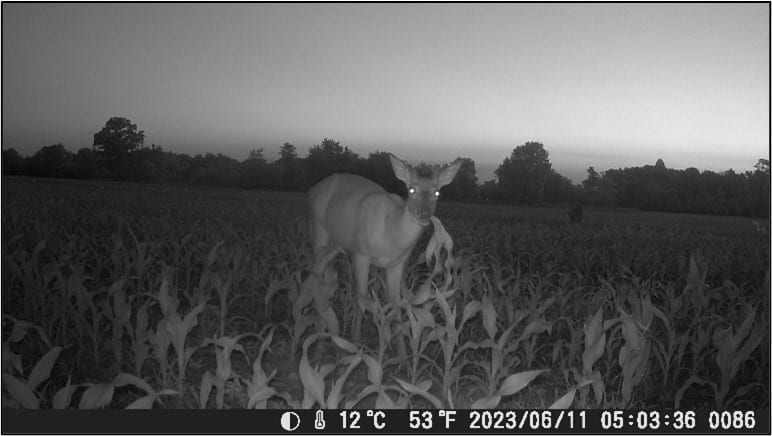
Figure 1: Deer being allowed to eat our plots because it was part of the research.
Based on some observations in prior years, we planted irrigated corn on three different timings (April, May, and June) to observe three outcomes 1) yield, 2) nutrient uptake, 3) herbivory by deer. Average yields were all below 200 bushels, at 143, 175, and 128 bu/acre in the April, May, and June planted plots, respectively. Yield losses are potentially related to a range of factors, including deer feeding, weather, and soil nitrogen.
Quick summary: There was no boost in yield or tissue N from Pivot-Bio additions, however we did observe higher levels of Mn in corn ear leaves with the biofertilizer. Yield may have been limited by something other than N.
To examine Nitrogen (N) contributions from biological fertilizer amendments, Pivot-Bio was added across a range of N-rates (0-330 lbs/acre) in the spring of 2023. The irrigated plots were harvested in October where yields ranged from 50 to 200 bushels per acre (Figure 1). The only statistical difference in yield was 0 N with pivot bio, which was lower than all other treatments. A dry cool May potentially reduced N availability in 2023, and heavy rainfalls and field saturation may have also limited yields. Drone imagery taken during the season will be analyzed at a later date to determine when yield may have become limited.
Figure 1: Yields based on Nitrogen rates and Pivot-Bio additions.Continue reading
October 28, 2023 / Jarrod Miller / Comments Off on 2023 Interactions Between Nitrogen, Planting Population, and Irrigation for Corn
Jarrod Miller, James Adkins
Quick summary: Irrigation boosted yields in southern Delaware by 30 bushels. Under irrigation, N-rates of 200 lbs averaged 247 bushels of corn, while maximum yield occurred at populations of 36,000 seeds acre-1. Rainfed conditions suppressed K uptake in the plant, while the opposite effect was observed with Mg.
Figure1: Research plots at the UD Warrington Irrigation Research Farm. Interactions include planting rates, nitrogen rates, and rainfed versus irrigated plots.
As part of research supported by the Maryland Grain Producers (https://marylandgrain.org/), we planted corn under irrigated and rainfed conditions under a range of populations (20-40,000 seeds acre-1) and nitrogen (N) rates (75-300 lbs acre-1). This research was performed at the University of Delaware Warrington Irrigation research farm (Harbeson, DE) in the summer of 2023 (Figure 1), where variable rate irrigation was used to create rainfed conditions across the field.
Quick summary: When available soil N is lower, rye cover crops may occasionally reduce yields while clover cover crops may occasionally improve yields. At adequate fertilizer levels, yields are not affected by cover crops on sandy, Delaware soils.
Figure 1: Corn nitrogen rate trials following cover crops in Georgetown, DE in the summer of 2023.
As part of the Precision Sustainable Agriculture network (https://www.precisionsustainableag.org/), a study was deployed across multiple states to examine the nitrogen (N) cycling that occurs with cover crops. Plots of rye, clover, and a rye-clover mix were seeded each fall over three years (2020-2023). In the spring, plots were terminated two weeks prior to corn planting and then sidedressed to reach total N rates between zero to 320lbs N/acre. The visual response of the variable N-rates can be observed in Figure 1.
The standard method used to follow and predict corn growth stages is using growing degree days (GDD). This is a calculation that uses average daily temperatures measure accumulated heat over the growing season. Using GDD works better than days from planting because cool spring temperatures slow early planted corn, while corn planted later in May can have a more linear growth pattern.
For the past three seasons in Georgetown we have followed our research plots and have these values as the average GDD for our area (Table 1). They will be similar to those found in other states, but represent averages and ranges for our region. You may find GDD values on our regional mesonet (DEOS) or through the Climate Smart Ag page at Cornell (edit the site location).
Emerge
V3
V6
V9
V12
VT
Average
109
262
556
871
1067
1308
Range
84-150
220-310
448–603
787-950
943-1272
1232-1363
R1
R2
R3
R4
R5
R6
Average
1486
1645
1891
2044
2287
2824
Range
1321-1594
1560-1743
1734-2067
1957-2187
2029-2509
2686-2926
Growing Degree Days (GDD) Average Accumulation to Reach Corn Vegetative and Reproductive Stages.