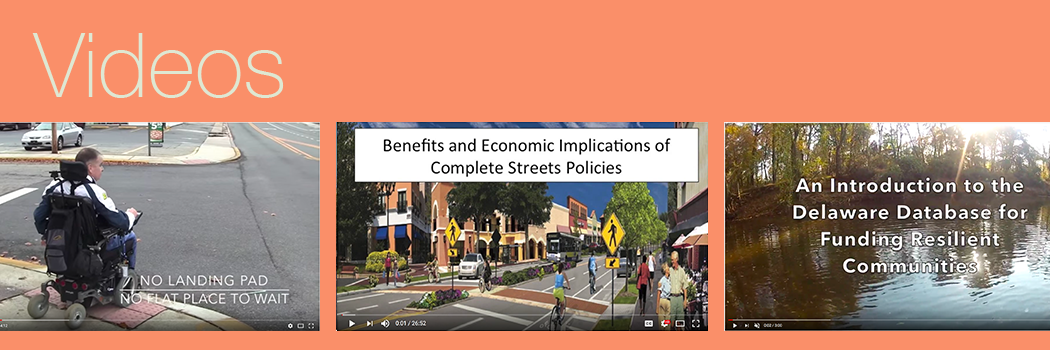
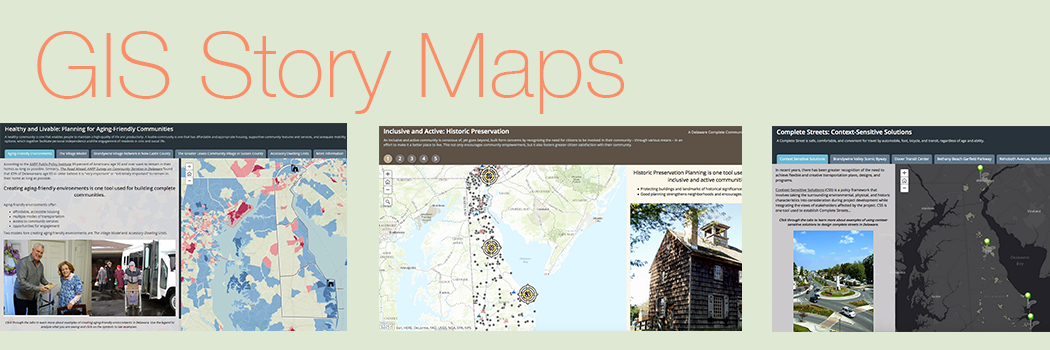
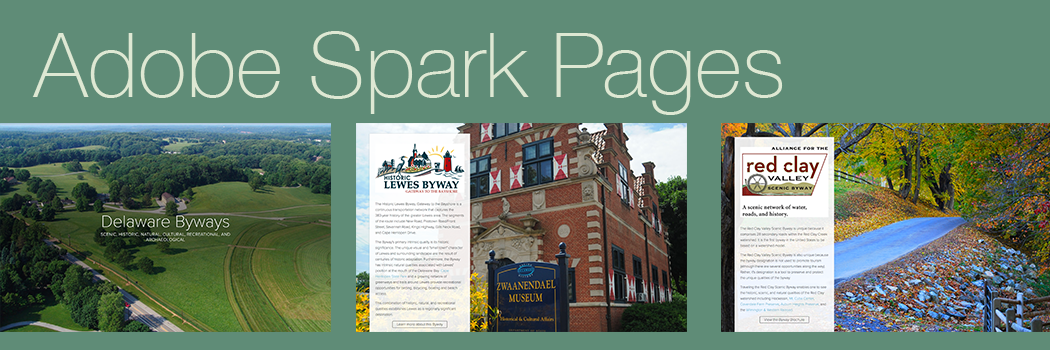
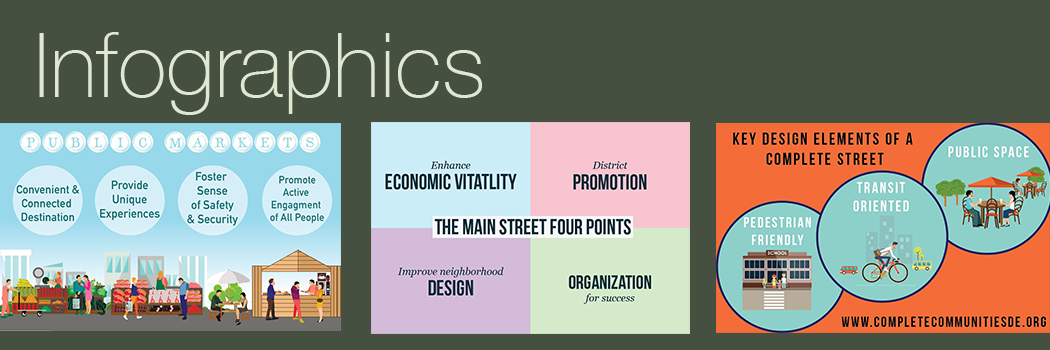
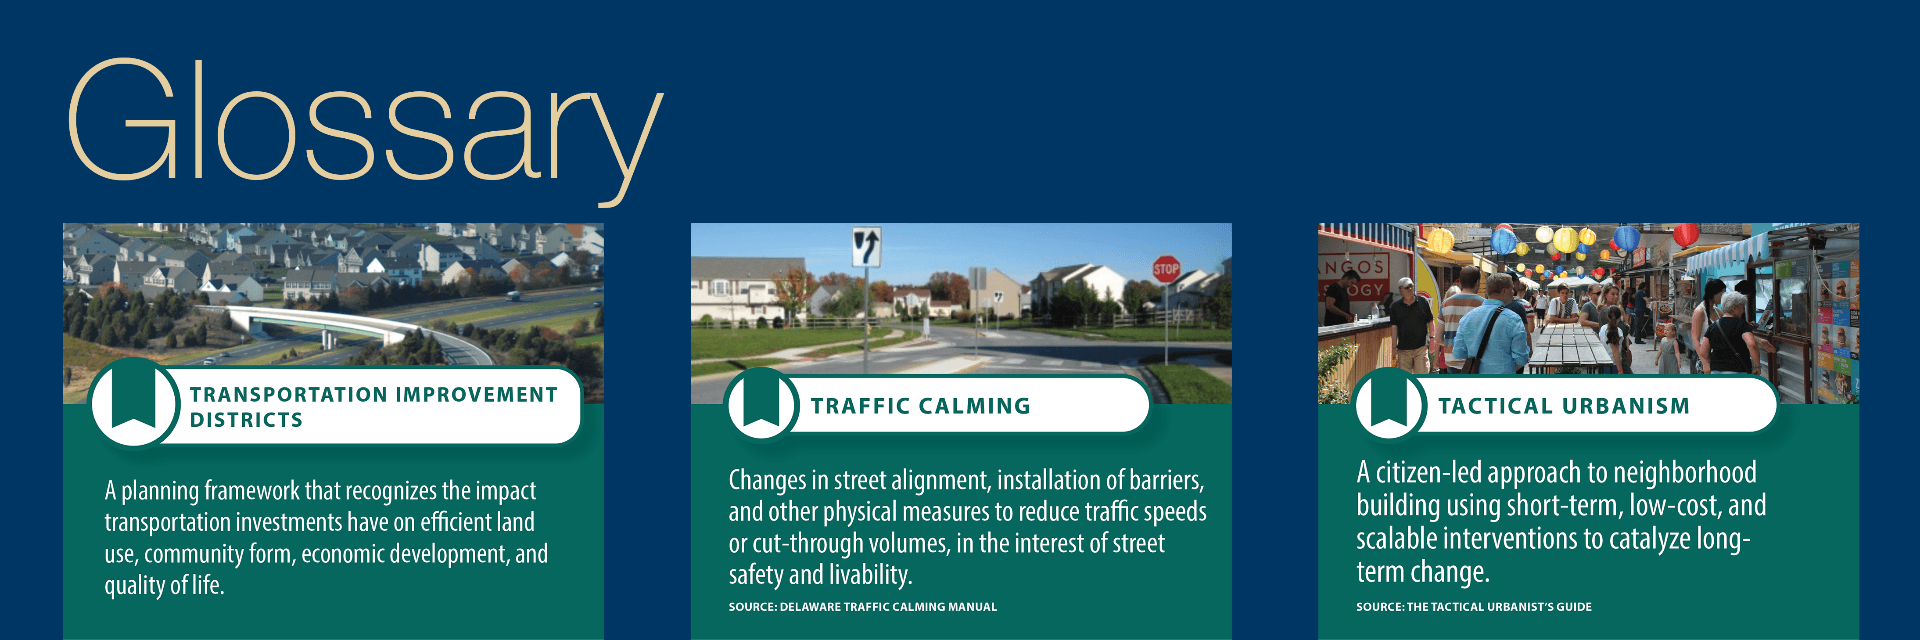
Visual tools are a means of graphically representing ideas, concepts, and data. In today’s digital landscape, visual tools are designed not only to foster an understanding of information, but to also promote communication and actively engage stakeholders in participatory planning processes. Visual tools are important because 65% of people are visual learners, 90% of information that comes to the brain is visual, and visual content is processed 60,000 times faster than text!
Please explore and share the following high-impact visual content related to planning for Complete Communities in Delaware.

