One, Two Step

Wrist pedometers are used by many to count their steps, and notify users when they “reach their 10,000”. These wearable devices quantify step activity and give indiviudals an idea of exactly how much they are moving throughout the day.

Accelerometers are often used within these wearable devices to detect the force acting on the device. The force acting on the accelerometer is correlated to an analog voltage output, which must be processed through a series of op amps to turn a users movement into an electrical output that can be analyzed through signal processing, but what signal processing circuitry is needed following the accelerometer within a wrist pedometer to correlate force acting on the pedometer to steps taken by the user?

In this post we will solve at the following engineering problem associated with pedometers: what signal processing circuitry is needed to convert the analog voltage input from an accelerometer to a binary digital signal that can be correlated to steps taken by a user?

Background 

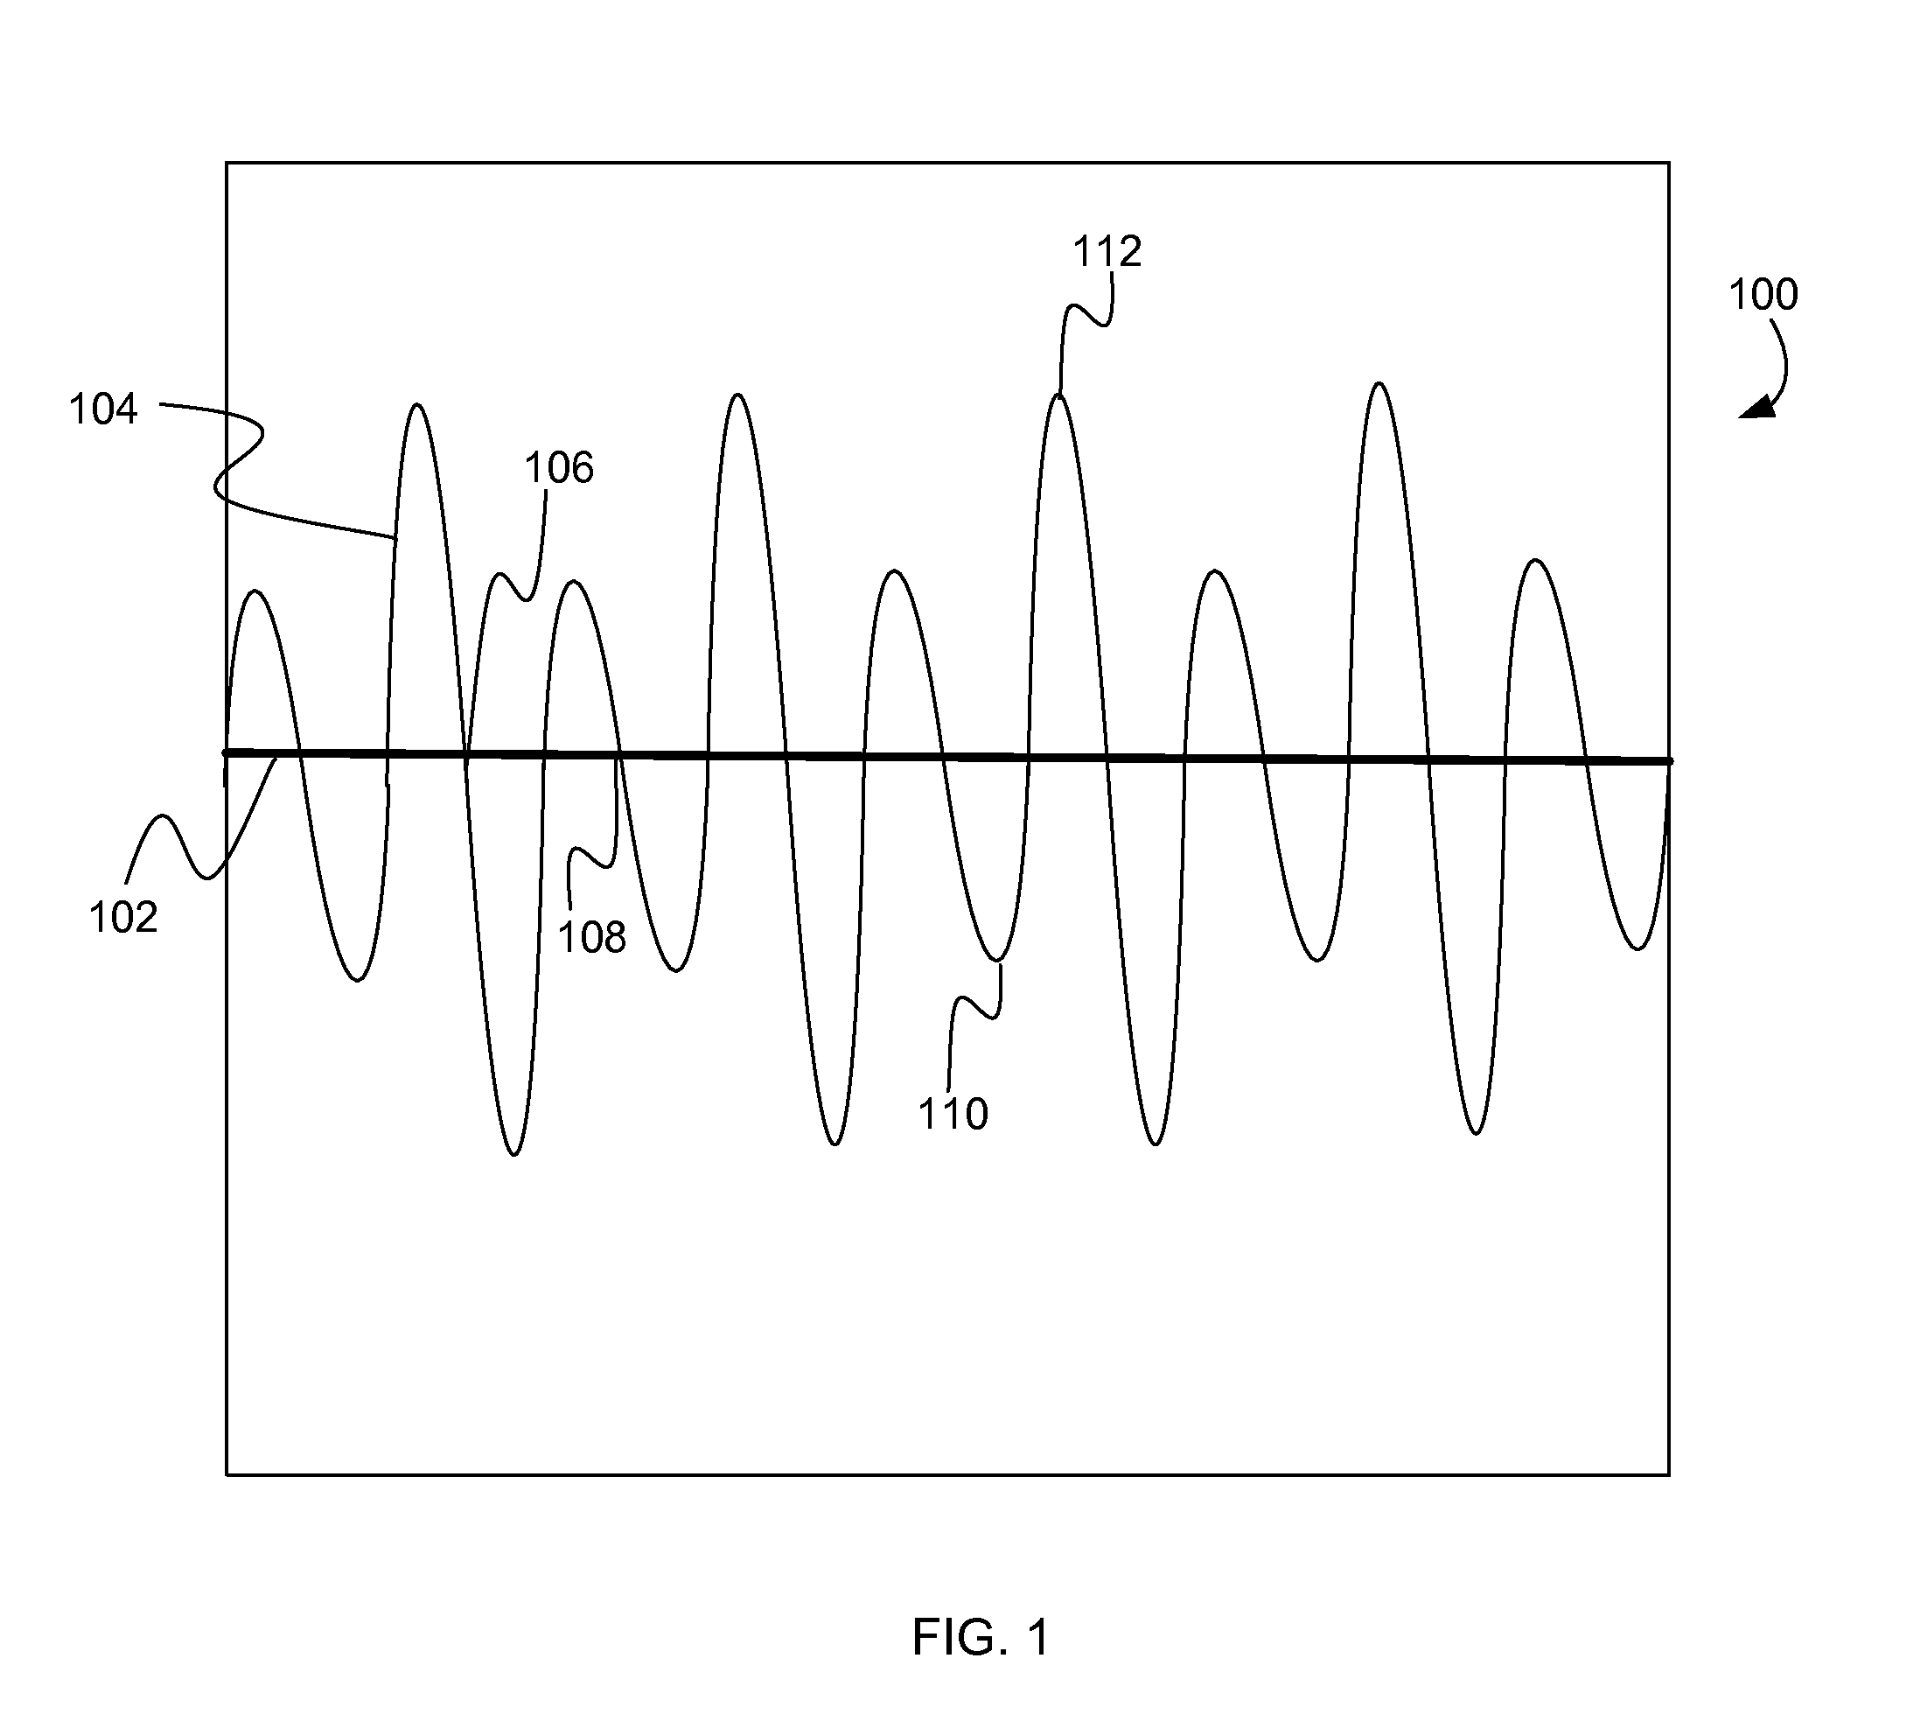
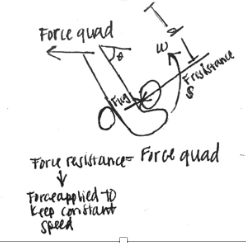
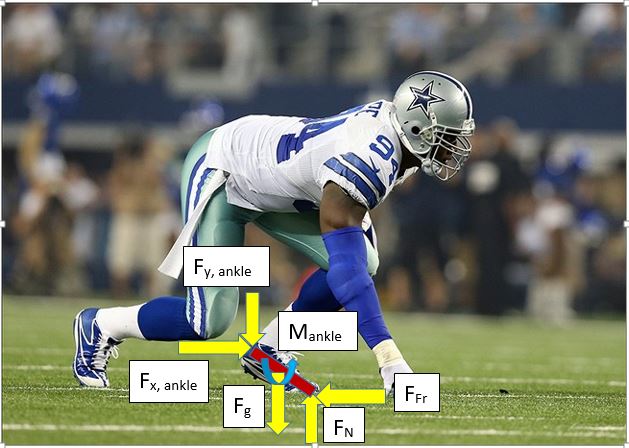
Figure 1. Force acting on wrist pedometer during gait cycle[1].

The average person takes between 0 and 120 steps per a minute. Throughout each gait cycle, a wrist pedometer experiences forces relative to its position, as shown in Figure 1. While standing the force detected by the pedometer is 1G (one times the force of gravity). When a user is pushing against the ground to step forward the force detected by the pedometer can rise above 1G, and while the user is between steps the force detected by the pedometer can go below 1G. The pedometer can detect when a user takes a step by monitoring forces and determining when the 1G threshold is crossed. Many wrist pedometers use a threshold of at least +/- 0.2G to prevent noise and standing movements from being accounted for in step count. So a step count will be equal to crossing the 1.2G and -1.2G thresholds[1].


Figure 2. Voltage Output as a function of force for Analog Devices+/- 2g accelerometer [2]

Accelerometers are often used to relate the force acting on an object to an electrical signal. Analog Devices, a circuitry component manufacturer, produces an +/- 2g accelerometer that relates forces between -2g and +2g to a voltage output, as shown in Figure 2. A linear region exists between +/- 2g, which can be defined by the following simplified function V(g)=(.875*g)+2.5 [2].

Approach 

In designing the signal processing circuitry necessary to convert an analog signal from an accelerometer to a binary digital signal, we will do the following:

1.Define the input signal in terms of force acting on a wrist pedometer, and the voltage output of an accelerometer

2.Determine the signal processing necessary to convert the analog signal into binary digital output

3.Select circuit components to complete desired signal processing, and appropriate values for integrated components

4.Use LTSpice to model desired circuitry, and confirm that designed circuit solves the defined engineering problem

Signal Input

It is known that the force acting on a wrist pedometer can be defined by a sine wave function fluctuating +/ 0.5g around 1g, with a frequency of 0-2Hz. Therefore we will define the force acting on the pedometer as F(t)= 0.5sin(t) + 1g. Given the voltage output of analog devices accelerometer is V(g)=(.875*g)+2.5, the voltage output of the accelerometer can be defined as V(t)=0.4105sin(t)+3.375.

Figure 3. Force acting on pedometer throughout gait cycle

Figure 4. Voltage signal generated by accelerometer from force input signal


Signal Processing

To generate a digital binary signal from an analog voltage input signal processing through circuitry is required.

Figure 5. Flow chart of signal processing of input analog signal from accelerometer to binary output signal

First, the input signal should be passed through a low pass filter, with a cutoff frequency of 2Hz to remove high frequency noise from the signal. The force acting on the pedometer, and voltage output of an accelerometer can be defined by sine wave functions. The baseline of accelerometer voltage output exists above zero volts, therefore a subtractor should be used to bring the baseline of this signal to 0V. A full wave rectifier will be used as an AC to DC converter, converting both polarities of the signal to a pulsating DC signal. A compactor will be used to produce a binary DC output that indicates whether the signal is above a given threshold, voltage relative to passing +/- 0.2g force threshold. This binary signal is the system output and can be used to count total steps taken by a user.

Circuit Components 

Circuit components were selected to complete necessary signal processing, and assumed to be ideal for simplification of solving this problem.

Low pass filter 

Figure 6. Low pass filter


With a cutoff frequency of 2Hz, a low pass filter with a Capacitor of 4.7 nF and resistor of 0.0169 Ohms can be used to filter out high frequency noise


Follower

Figure 7. Op amp acting as follower


Follower used to preserve signal and prevent current flow back to the user


Subtractor 

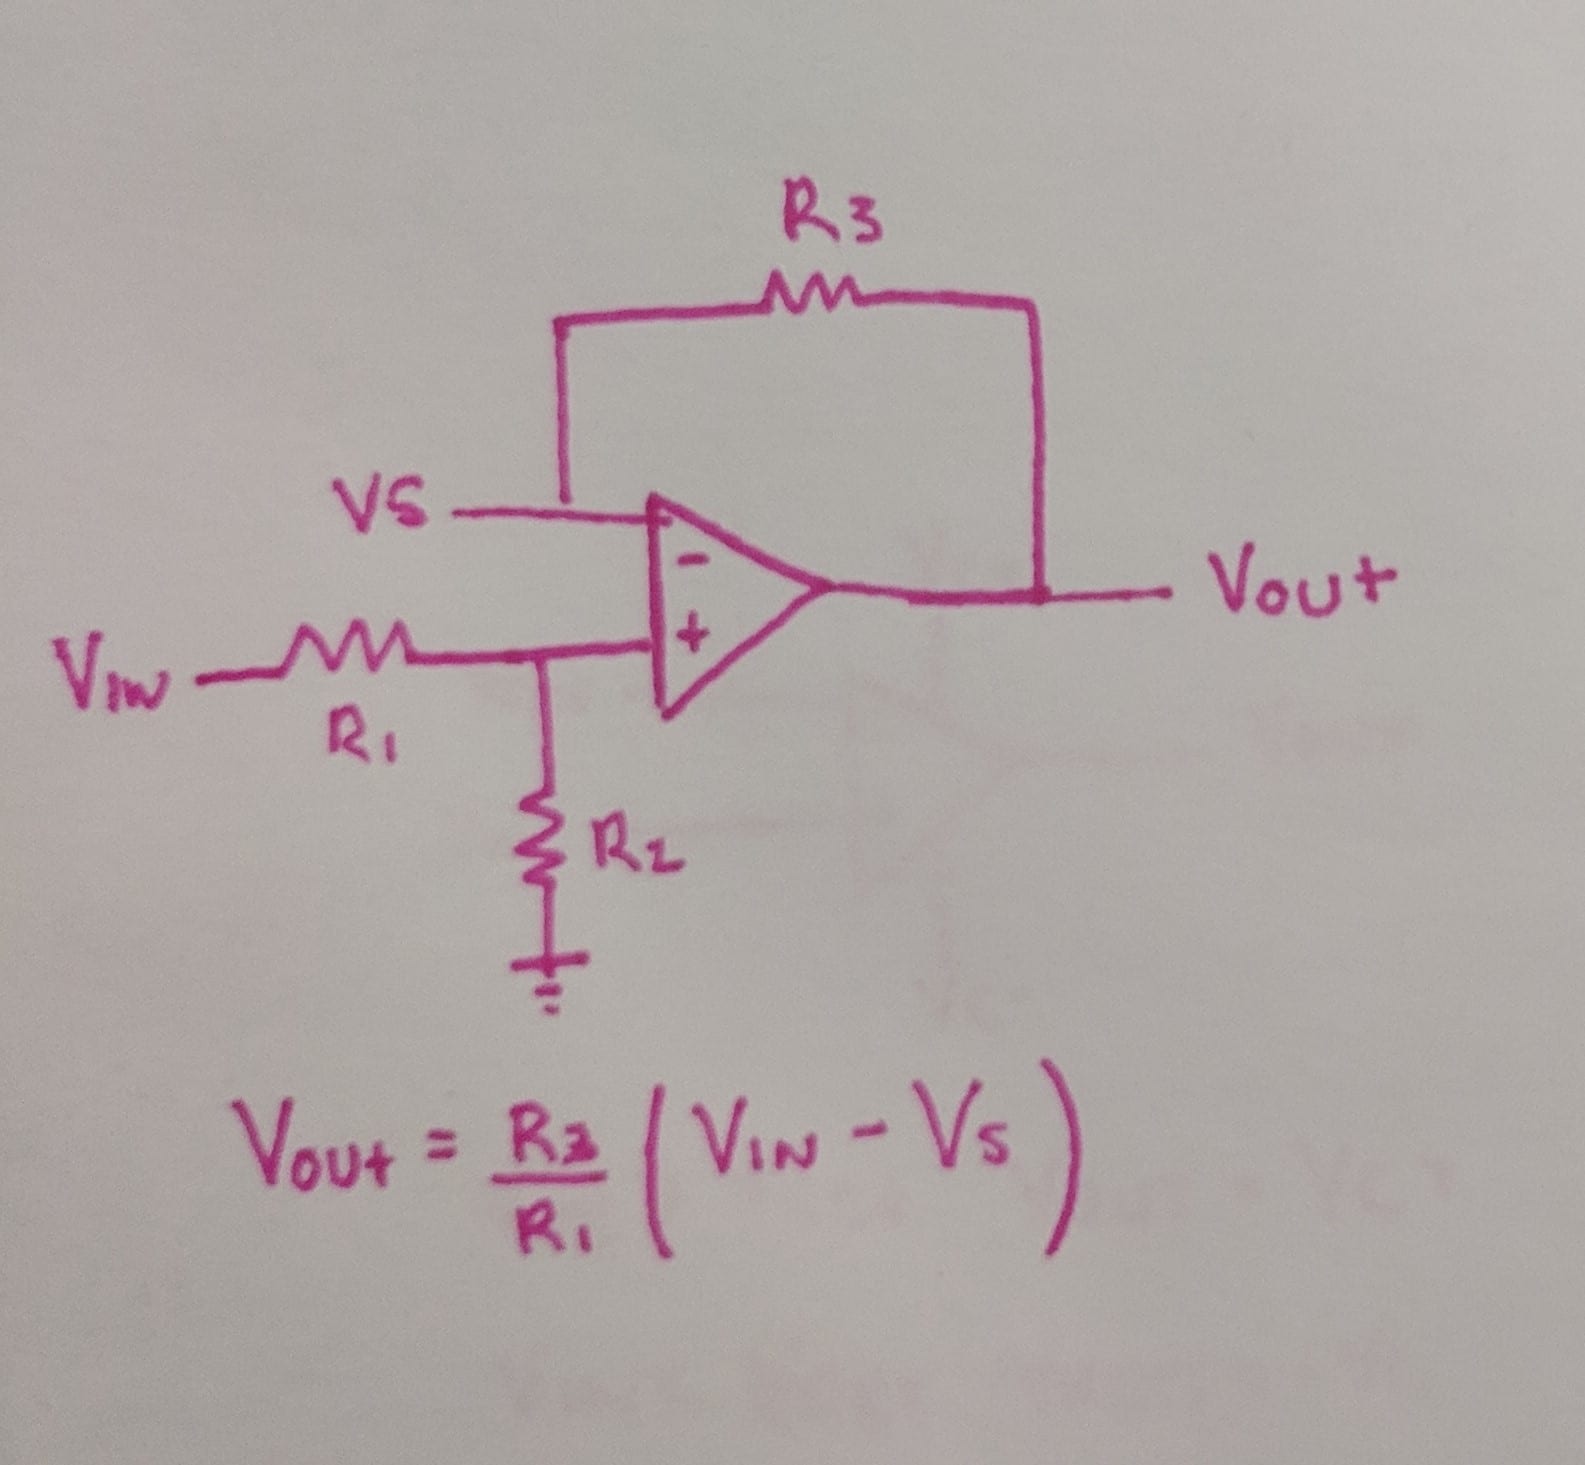
Figure 8. Op amp acting as a subtractor


A subtractor can be used to reduce the baseline signal to zero. Given our voltage input is V(t)=0.4105sin(t)+3.375 V, and the Voltage output of this component is Vout = (R3/R1)*(Vin-Vs), we will set Vs=3.375V DC and R1=R2=R3=100 Ohm to bring the baseline signal down to 0V.


Full Wave Rectifier

Figure 9. Op amps acting as a full wave rectifier


A full wave rectifier will be used to convert all polarities of the input signal to the same polarities. If R1=R2=R3=R4=R5, then if Vin>0 Vout=Vin and Vin<0 Vout=-Vin. Therefore, we will set all the resistors equal to each other to achieve a rectified DC signal.


Comparator 

Figure 10. Op Amp acting as a comparator

A comparator will be used to convert the pulsating DC signal to a binary digital output. Op amps functioning as comparators follow the rule that if V+>V- Vout = Vc+ and V->V+ Vout=Vc-. In our ideal circuit, we aim our binary signal to be either 0 or 1.

V+ terminal will be our signal, and we look to determine if this signal represents crossing the 1.2g threshold. To find what the V- terminal should be we need to determine the voltage at this point in the circuit if it has crossed the threshold. Given, V(g)=(.875*g)+2.5, V(g=1.2)=3.52. The signal is brought through a subtractor where it is reduced by 3.375 and afterword is no longer amplified or modified, so the threshold voltage at this point is 0.1534 V. The negative input terminal will be set to be a DC voltage of 0.1534V.

To generate a binary output where 0V= not crossing the threshold and 1V= crossing threshold, the op amp terminals will be set to be Vc+ = 1V and Vc-=0V.

LTSpice Modeling and Verification 

Figure 11. LTSpice signal processing circuit following accelerometer to convert analog accelerometer signal input to binary output


LTSpice was used to model the designed circuit, as shown in figure 11. This circuit was simulated using LTSpice software and it’s ability to produce a binary digital output from an analog signal was verified as depicted in figure 12.

Figure 12. Voltage input, green, and output, blue, of signal processing circuit in figure 11

Solution

Our goal was to design signal processing circuitry is needed to convert the analog voltage input from an accelerometer to a binary digital signal that can be correlated to steps taken by a user.

Figure 13. Accelerometer analog output signaling processing circuit to produce binary digital output

A series of signal processing components were integrated within a circuit, depicted in figure 13, to convert an analog voltage signal from an accelerometer into a binary digital signal. This circuit removes high frequency signal noise, reduces the signal baseline, generates a pulsating DC signal, and generates a binary signal output, as shown in figure 14.

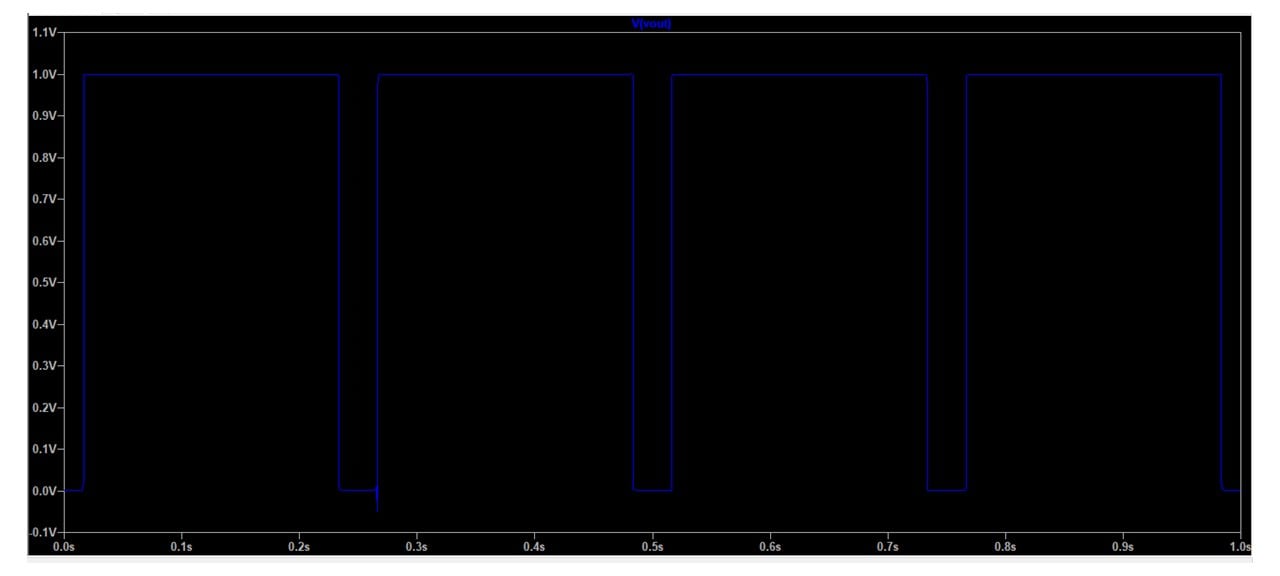
Figure 14. Binary digital output of accelerometer signal processing circuit

This binary digital output can be correlated to steps taken, as two square waves is equal to one step taken. These square waves can be counted by an integrated software and used to count user steps. Thus, turning the analog accelerometer voltage output into a binary digital signal.

This binary signal can be used to count steps and step frequency, and when integrated with GPS and other technologies can be used to determine step distance and user speed.

With one two sqaure waves equaling a step, the designed integrated circuit turns user movement into step count, enabling the signal processing necessary to count those 10,000 steps everyone is so desperately trying to reach!

References

[1] Modi, Yash Rohit. (2014). United States Patent No. US20140074431A1. Retrieved from https://patents.google.com/patent/US20140074431A1/en

[2] “Accelerometer Specifications – Quick Definitions.” Accelerometer Specifications – Quick Definitions | Analog Devices, www.analog.com/en/products/landing-pages/001/accelerometer-specifications-definitions.html.

Isokinetic Dynamometry Engineering Problem

Isokinetic Dynamometry Engineering Problem:

An 18-year-old, 5’4”, 130 lbs female soccer player is just recovering from an ACL tear and wants to know if she can get back in the game. She has been super cautious and tentative to rehab strength exercising routines, so she is sure she is ready, but wants to quantify her strength. To do this, she decides to measure her quadricep and hamstring strength on an isokinetic dynamometer and evaluate her hamstring to quad ratio, which should be between 50 and 80 percent [1]. Other important values include power, work, and peak force to assess the muscle and plan for future rehab exercise routines.

Based on previous studies, to test for power and strength of a muscle, the optimal speed is 60º/sec [2]. She also performs the test with a range of 0-90 º. The results of her hamstring force came back as 54.663 lbs and her recorded quadricep torque value determined by the isokinetic dynamometer is 102.45 lbs*ft3. The patient also wants to know her kick velocity (for fun). The computer is not properly calculating important values, and hand calculations must be performed to ensure accuracy. Calculate the power, work, and force of the quadricep, the angular speed at which the leg kicks, and the hamstring to quadricep ratio to determine if the patient can go back to playing.

*See attached anthropometric weight and measurement documents to determine distance and mass


Solution:
Assumptions: To simplify the math, we are ignoring the effects of gravity and inertia from the swinging limb. In real life, they play a major part in the force read by the machine and there are algorithms the computer goes through to factor out the effects. Also, the math that is performed based on the free body diagram is the forces on the knee joint, not just the quadricep. There are many forces that play a part, but for simplicity reasons we will treat them as only the force produced by the quadricep. Furthermore, there are other considerations when thinking about ACL recovery such as muscle strength and also whether or not the muscles are even. In this problem, we only look at one muscle and do not do a comparison.

1.Since Torque is given (102.45 lbs*ft), Force can be found by

Torque=〖Force〗_quad x d or 〖Force〗_quad*d_perpendicular
First: find perpendicular distance, which will be the length from the patient’s knee to ankle (d on free body diagram)
From the anthropometric table, the distance is Height*(0.285-0.039), where H= 5.33 ft.
Therefore. d=1.312 ft

102.45 lb*ft=〖Force〗_quad*1.312ft
〖Force〗_quad=78.09 lbs

2.Now that Force of the quadricep is found, we can solve for work

The distance, in this case, is the distance the leg travels, which will be the arch distance
s (arch distance)=rθ
r in this case is equal to d. Also, the range (θ) is 90 º, which in radians is 1.571 (90*(π/180))
s=(1.312)(1.571)= 2.06 ft
Now that we have d, multiply by force to get work
Work=78.09 lbs*2.06 ft=160.96 ft*lbs

3.Power can be solved by using the equation

Power=torque*angular velocity
Angular velocity is 60º/sec, which in radians (multiplied by (π/180)) is 1.047 s-1
Plugging in,
Power=102.45lb*ft*1.047 s^(-1)=107.28 (ft*lb)/sec

4.To find angular velocity (ω) her leg is going, the angular acceleration must be determined based off of the force exerted by the quadricep

The following equations must be used
F=m_lowerleg*a_n
a_n=ω^2 r,where r=d
*Note: Since there is a circular motion, angular acceleration must be assessed. Since there is a constant velocity, there is no at component.

Using the weight chart, you should find the weight of the lower leg is 0.0618*weight, which in this case is

(0.0618*130 lbs)/(32.2 )=0.2495 s

Therefore:

78.09 lbs=0.2495 slugs* ω^2*1.047 ft
ω^2=298.7 rads/sec
ω=17.28 rads/sec (times 180/π to get degrees)
ω= 990.2 º/sec

5.Finally, to find hamstring to quadricep ratio

Ratio=(Hamstring Force)/(Quadricep Force) x100
Ratio=54.663/78.09 x100=70%
Therefore, it can be concluded the patient can return back to the field

Overall
Force (quad) = 78.09 lbs
Work=160.96 ft*lbs
Power=107.3 ft*lbs/sec
Angular Velocity = 990.2 º/sec
Hamstring/Quad ratio = 70%
All of these values make physiological sense and line up with average results from other research[3,4]

Tables

Figure 1: Mean Segment data taken from https://exrx.net/Kinesiology/Segments


Figure 2: Anthropometric data showing body segment length as a function of total height. From Winter, D.A., Biomechanics and Motor Control of Human Movement, Wiley Interscience, New York, 1990

Sources:

  1. Rosene, J., Fogarty, T., & Mahaffey, B. (201). Isokinetic Hamstrings:Quadriceps Ratios in Intercollegiate Athletes. Journal of Athletic Training,36(4), 378-383. Retrieved from https://www.ncbi.nlm.nih.gov/pmc/articles/PMC155432/pdf/attr_36_04_0378.pdf.
  2. Duarte, J. P., Valente-Dos-Santos, J., Coelho-E-Silva, M. J., Couto, P., Costa, D., Martinho, D., … Gonçalves, R. S. (2018). Reproducibility of isokinetic strength assessment of knee muscle actions in adult athletes: Torques and antagonist-agonist ratios derived at the same angle position. PloS one13(8), e0202261. doi:10.1371/journal.pone.0202261
  3. Holmes, & Alderink. (1984). Isokinetic Strength Characteristics of the Quadriceps Femoris and Hamstring Muscles in High School Students. Physical Therapy,64, 914-918. Retrieved from http://citeseerx.ist.psu.edu/viewdoc/download?doi=10.1.1.1016.6759&rep=rep1&type=pdf
  4. Heyward, V.H. (2010) Advanced fitness assessment and exercise prescription (6th Ed.) Champaign IL: Human Kinetics


Engineering Concerns for a Portable NIRS Device

When designing a portable Near-Infrared Spectroscopy (NIRS) device for the measurement of muscle oxygenation, design engineers have plenty of factors to consider. They must think about battery life, portability, affordability, safety, and many other design criteria. Before considering many of these criteria, however, an engineer must design a working technology that is capable of actually measuring muscle oxygenation. Without this basic attribute, the device would be a complete failure. The basics for measurement of relative oxygenated and deoxygenated hemoglobin concentrations was introduced previously in the patent blog post, but the engineering design problem was mostly glossed over. This post will dive a little deeper into the quantitative nature of measurement of muscle oxygenation and what functions the design engineer must consider when designing a device that will operate properly and accurately. The main question to be answered is: how does an engineer use light to measure concentration of a particle in muscle?

Fig 1: Molecular Absorption Coefficient Profiles for Oxygenated and Deoxygenated Hemoglobin

As mentioned before, NIRS works by measuring the absorbance or attenuation of light as it passes through a sample to make a measurement of concentration of the absorbing analyte or particle. Also previously introduced were the benefits of using near-infrared light since it can pass through biological tissue and is primarily absorbed by hemoglobin. In an ideal world the absorbance is defined by the Beer-Lambert Law. According to this law, the absorbance of a particle is equal to the natural log of incident light over the detected light and this is further equal to the product of the molar absorbance coefficient, the concentration of the particle, and the mean path length of detected photons. In an ideal case this law works because it describes when light is shown through a glass cuvette with a solution with only one absorbance particle, but this is not helpful for a NIRS device for muscle oxygenation. Thus, for a NIRS device, the modified Beer-Lambert Law must be used, which is the same as the original equation but with an extra scattering term to account for photon scatter when passing through tissue like skin and muscle (Eqn. 1).

Here A is absorbance, I0 is incident (transmitted) light, I is detected light, ɛ is molar absorbance coefficient, c is concentration, L is mean path length, and G is the scattering term. This is great in theory because it appears that concentration can be calculated relatively easily, but there are further problems to solve. Start by considering the knowns and unknowns. The absorbance coefficient is a known value for any analyte given the wavelength of the laser used (Fig. 1), and the path length can easily be found from the distance between the light emitter and detector with some regards to the path shape which is known to be roughly banana shaped. This leaves two unknown terms: the unknown that to be measured, i.e. concentration, and the scatter term. The scatter term is unfortunately a problem. It varies by tissue and considering the device should be designed for consumers to use on different locations, different muscles, and different amounts of say fat that may lie in the way of the muscle, this G term will forever be changing. Thus, there needs to be a way to get rid of it. The easiest way to do this is to find change in absorbance so that G will be subtracted away. This uses the assumption that G is constant for a given location. The resulting equation will then give change in concentration as it is the only factor that changed between measurements 1 and 2 (usually an initial measurement and a second measure at a later time) (Eqn. 2). Notice that absorbance is now equal to the natural log of the first intensity detected divided by the second intensity measured based on the identity (log(x/y) = log(x)-log(y). Note that the need to get rid of G, because it cannot be calculated on every single consumer, leads to the fact that NIRS devices almost always measure change in concentration or relative concentration when measuring muscle oxygenation.

This equation looks great. So change in concentration as opposed to exact concentration is found, but so what, this is still a very helpful measure for oxygenation during exercise. BUT, this equation is not the whole story. NIRS works by measuring both oxygenated and deoxygenated hemoglobin (Hb). Both species of Hb contribute to absorbance in the near-infrared range. Thus the equation actually looks like this (Eqn. 3)

In this equation, subscript O is used for oxygenated Hb, and subscript Hb is used for deoxygenated Hb. Now there are two unknowns and only one equation. So what does a smart engineer do? They add more lights. By measuring multiple wavelengths, two changes in absorbance can be measured allowing both concentrations to be calculated by solving the system of equation (Eqn. 4-5).

In these equations, superscripts refer to the wavelengths of light 1 and 2. It must be remembered that absorbance coefficient, absorbance change, and path length will all vary based on wavelength. This clearly allows for the output of relative concentrations or total blood oxygen saturation percentage (oxyHb / [oxyHb + deoxyHb]). Here the assumption is that total Hb is equal to oxyHb plus deoxyHb. The last piece of the puzzle for an engineer is to decide on what wavelengths should be used for the lights. This is a very impactful decision in building the algorithm to calculate the outcome measures of the device since ɛ, A, and L all depend on wavelength. It should be noted based on Figure 1 that certain wavelengths will be better than others. For example, if 805 nm light is used, then the absorbance coefficients for both species of Hb will be the same. This leads to irrational answers for Equations 4 and 5, so this wavelength should be avoided. The best case is to pick a wavelength above and below this so that one is more sensitive to oxyHb and the other is more sensitive to deoxyHb. Thus, using 750 and 850nm could be viable options, and these are used in several current devices.

These results allow an engineer to design a device that will properly measure muscle oxygenation through the relative concentrations of oxygenated and deoxygenated Hb. A reminder that some of the assumptions that needed to be made were that the tissue was homogenous, that oxy and deoxy Hb are the only particles contributing to absorbance, that absorbance is constant in time when Hb concentrations do not change, that the scattering term remained constant, and that oxy + deoxy Hb is the total Hb. Realistically, tissue is not homogeneous, but this assumption causes smaller errors in the volumes being considered close to the skin surface. Unfortunately, Hb is not the only chromophore contributing to absorbance. Fat is a major problem because it shares a similar range of wavelengths for absorbance. Some devices take fat correction into account, but other do not, and papers have pointed this out. It is reasonable to assume that absorbance is constant in time when concentration is constant, but pulsatile flow can cause error here. The scattering term should remain constant if the position of the device is not changed, and it is also reasonable to assume that there are not Hb species besides oxy and deoxy in the muscle. Some of these do cause limitations to the design described here, and as already mentioned it will only measure change in concentration not the absolute value. In conclusion, two wavelengths of light are needed measure muscle oxygenation with NIRS.


References

[1]. Shimadzu Commercial Website https://www.ssi.shimadzu.com/products/imaging/labnirs-principle-of-operation.html

[2]. Kocsis, L., Herman, P., & Eke, A. (2006). The modified Beer-Lambert law revisited. Physics in Medicine and Biology, 51(5). http://doi.org/10.1088/0031-9155/51/5/N02

[3]. Len-Carrin, J., & Len-Domnguez, U. (2012). Functional Near-Infrared Spectroscopy (fNIRS): Principles and Neuroscientific Applications. Neuroimaging – Methods. http://doi.org/10.5772/23146

[4]. McManus, C. J., Collison, J., & Cooper, C. E. (2018). Performance comparison of the MOXY and PortaMon near-infrared spectroscopy muscle oximeters at rest and during exercise. Journal of Biomedical Optics, 23(01), 1. http://doi.org/10.1117/1.jbo.23.1.015007

Better Building: Making An Accurate Wearable

Identify:

Heart rate measurements are a very versatile and useful tool for both starting and veteran athletes. Among many other uses [1], it can be used as a general gauge of how hard you are working out at that moment, and it can help determine improvement as your max heart rate increases. But putting a hand to your chest and counting the beats per minute is an impractical way to measure heart rate. So to help us measure this useful metric, we have heart rate monitors that can take our heart rate for us.

On the market, there are two types of heart rate monitors: Chest-strap monitors and wrist-strap monitors. Most people who aren’t even athletes probably have a wearable that can monitor heartbeats. Even most modern phones have the ability to measure your heart beats. However, despite their ubiquity, they have one major downfall: Wrist-strap monitors simply aren’t incredibly accurate. Besides the point of location, the wrist has several different factors [2] that make it difficult to get a good reading, ranging from skin-tone to motion. All of these factors produce noise that helps to muddy the results and can produce odd and inaccurate readings. To ensure we get the most accurate results to accurately determine our exercise maximum, it is this noise that we must turn to curb. But how do we go about reducing noise?

Formulate:

Modern wearable HRMs use a technology called photoplethysmography or PPG. In essence [3], the device shines a light through a bulb (usually an LED), that passes through the skin and muscles. A majority of this light will be absorbed by the surrounding skin and muscles. The blood absorbs the light that does make it through, which is the crux. By measuring the amount of light that is absorbed, the device can pick up on pulses in the blood based upon the differences in these absorbances. This technology is very similar to how spectrophotometers work, with both measuring the absorbance that a material has. But unlike a spectrophotometer which measures the absorbance through the material, PPG measures constantly, listening in for very small changes in absorbance that can be used to determine heart rate.

An example of PPG. Pulses within the vessel cause even more light to be absorbed than would normally. This is what the wearable is measuring.

PPG is very sensitive to physical sensations like bumps and pumps, which produces noise. When the sensor is jostled due to motion, the small amount of signal that is recorded gets muddled, which produces the majority of the noise that we are trying to cut down. This noise can cause very odd results, such as heart rates that vary wildly [4]. The noise is not present while not in motion, but for athletes who want to know how high their heart rate can get, this is not acceptable. As noise caused by motion is the leading cause of these very odd discrepancies in heart rate, we need to lower it as much as possible.

In order to solve this, we are going to separate the signals read between three metrics: a DC, an AC, and a noise component. We shall be ignoring noise caused by the optical signal, as it is subtracted by the sensor through the use of ambient light measurements [5]. Thus, the incoming current that is read can be simplified as:

Incoming Current = DC component + AC component + Noise

The DC component of the signal comes from changes in respiration in the vessel, while the AC component comes from variation in blood volume due to the heartbeat.

Solve:

If we want to reduce the amount of noise, we are going to have to pass the incoming signal through a filter. When the signal comes back to the wearable, it must interpret the signal, from raw absorbance values to electrical signals that are then interpreted by the wearable. And since we assume that optical light noise is negligible, we can focus on removing noise due to motion. Using biophysical-signal characterization techniques [6] as our filter, we can compare the incoming signal, and remove noise caused by motion. The remaining non-noise components will have to be amplified in order to get a complete, accurate signal. We do this in order to fill in the gaps made when we remove several points of noisy data.

By using a current filter, we hope to minimize the amount of noise that is detected alongside the heart rate of the monitor. If we can eliminate the noise read alongside the signal, we can get more accurate results, as the signal interpreted would consist only of the AC and DC components. However, this approach focuses only on noise made by motion. As stated before, there are several different sources of noise that interfere with accurate measurements. While motion is one of the primary sources of noise, other factors like skin tone, gaps between the sensor and the skin, and the location of the sensor can introduce more noise. This solution also has the possibility of cutting off accurate readings that are interpreted by the sensor as noise. Athletes who do a lot of vigorous exercises may find that their heart rates are inaccurate under this solution if their heart rates spike hard enough during exercise.

[1]: Shmerling R. How’s your heart rate and why it matters? – Harvard Health. August. https://www.health.harvard.edu/heart-health/hows-your-heart-rate-and-why-it-matters. Published 2017.

[2]: LeBeouf S. Five Challenges of Optical Heart Rate Monitoring. Sensors online. https://www.sensorsmag.com/components/five-challenges-optical-heart-rate-monitoring. Published 2016.

[3]: Cheriyedath S. Photoplethysmography (PPG). News Medical Life Sciences. https://www.news-medical.net/health/Photoplethysmography-(PPG).aspx. Published 2016.

[4]: Oniani, Salome & Woolley, Sandra & Pires, Ivan & Garcia, Nuno & Collins, Tim & Ledger, Sean & Pandyan, Anand. (2018). Reliability Assessment of New and Updated Consumer-Grade Activity and Heart Rate Monitors. 10.13140/RG.2.2.35628.72328.

[5]: Wearables | OSRAM. https://www.osram.com/os/applications/mobile-competence/mobile_competence_wearables.jsp.

[6]: Maity S, He M, Nath M, Das D, Chatterjee B, Sen S. BioPhysical Modeling, Characterization and Optimization of Electro-Quasistatic Human Body Communication. IEEE Transactions on Biomedical Engineering. http://arxiv.org/abs/1805.05200. Published May 14, 2018.

Personalized BioElectrical Impedance Analyzer

Identify

 It is common for people worry about their Body Mass Index (BMI) values after visiting the doctor’s office. What many people don’t know is that these BMI values do not take into account what body weight comes from muscle and what comes from fat. This can be hard for individuals who contain high amounts of muscle, which weighs more than fat, and get a BMI value back saying that they are overweight.

One way to differentiate between an individual’s fat free mass (FFM) and their fat mass (
FM) is by using a bioelectrical impedance analyzer. These analyzers work by sending a low electrical current through the body from one electrode to another. This electrical current will pass quickly through hydrated tissues such as muscle and slowly through low hydrated tissues like fat.


There are many different factors to be taken into consideration when programming a bioelectrical impedance analyzer as shown above. Many estimated values for these analyzers come from average values and standard deviations of measurements from more accurate body composition tests such as hydrostatic weighing or Dual-energy X-ray absorptiometry (DXA). Specific equations based off of these values must be input into the system that will be able to give back estimates of an individual’s specific body composition given an input of the individuals weight, height, and gender. The problem with these analyzers is that the estimated values don’t accurately or even closely relate to each individual.

 Formulate

For a bioelectrical impedance analyzer, the impedance value is mathematically found from the equation Z^2 = R^2 + Xc^2. Within this equation Z is the impedance, R is the resistance, and Xc is the reactance. The resistance is the opposition of a conductor to the alternating current and the reactance is the additional opposition to the current from the storage effects of the cell membranes and tissue interfaces.

As an engineer it is important to find the right programming equations for the technology being made. These equations will vary in accuracy depending on the sex and ethnicity of its user. After the impedance has been calculated from the electrical current, it will need to be plugged into an equation, along with height, weight, and gender to find fat mass. When using segmental analyzers each different segment being measured will use its own specific equations for FM and the segments will then be summed for a total body FM. A typical FM equation for a non-segmental analyzer for ages 16-80 may be set up as:

FM(kg) = C1 + C2 Age + W + C3 (H(m)^2 / Z) – C4 H(m)

Where H(m) is height in meters, W is weight kg, Age is age in years, Z is from the previous equation depending of the testing frequency and each C variable is a different constant. The constant values will be determined using linear regression models of data taken on a group of individuals using a different form of body composition analysis.

The following assumptions can be made when programming the equations:

  1. The electrical current follows the path of least resistance within the body
  2. Both the body and its specified segments follow a cylindrical ‘typical’ shape

If these two assumptions hold true and the following equations are programmed correctly an FM estimate can accurately be made.


Solve

 The following measurements and calculations will then be made for fat mass:

Z^2 = R^2 + Xc^2

FM(kg) = C1 + C2 Age + W + C3 (H(m)^2 / Z) – C4 H(m)

Using the standard deviations as C values from data taken from a previous body composition study in Japanese women [1],the following equation can be determined:

FM(kg) = 37.91 + 18 Age + W + 0.6144 (H(m)^2 / Z) – 6.7 H(m)

Using these calculations along with a weight measurement from a scale an individual can then accurately assess their body composition health and fat free mass rather than using the BMI percentile chart.

Weight = FFM + FM

FFM = Weight – FM

It is important to understand that this developed equation will be limited only to Japanese females. If a scale programmed to find fat mass using this equation was used by a male, even a Japanese male, they would get an inaccurate reading. These reading will be inaccurate mainly due to the differences in how each sex and different ethnicities hold water within their body. This equation found for a BIA scale would be reasonable for female Japanese users only. In order for the scale to be reasonable for other individuals the programmed equation will need to be changed based of previous body composition findings of other groups based on ethnicity and sex.

Further Readings:

 https://www.sciencedirect.com/science/article/pii/S0261561408000666?via%3Dihub

https://www.ncbi.nlm.nih.gov/pmc/articles/PMC4608267/#CR18

References:

 https://www.ncbi.nlm.nih.gov/pmc/articles/PMC5551247/

 Image Sources

 https://www.valhallawellness.com/weight-loss-services/bioelectrical-impedance-analysis/

Barbells: Withstanding the 1,000-lb Deadlift

Identify

Barbells have been used for strength training for centuries, and the basic design of those used today was invented in 1928, yet they remain one of the most popular and effective exercise tools out there. From the main power lifts of bench, squat, and deadlift, to the olympic lifts of clean, jerk, and snatch, and limitless other movements, a barbell can be used to target any muscle group to improve strength and power. However, it must retain its shape. Through countless loading cycles, years of use, and sometimes extreme bending stresses, a barbell needs to be ready to be picked up and used again right away, and that means it cannot yield, or permanently bend – this would make it more difficult to use, change its motion patterns, and put it at risk of breaking. While typical use of a barbell for most people would not push it to its mechanical limits (Figure 1), those who compete in weightlifting often place so much weight on the ends of the bar that it indeed bends very much (Figure 2).  A barbell must be constructed of the proper material to withstand the loads it is placed under and bend without becoming permanently bent – or, in engineering terms, deform elastically but not plastically.

Figure 1. Use of a loaded barbell to perform a deadlift

Figure 2. Use of an extremely heavily loaded barbell to perform a deadlift

Formulate

When it comes to competition weightlifting, there are actually different dimensions and specifications required of barbells used for different lifts – read about it here. I decided to focus on a barbell for deadlifting because it’s the movement that can be done with the most weight and is not dynamic like olympic lifts. I borrowed dimensions from the most commonly-used barbell for deadlifting, the Texas 7-1/2″ Bar (Figure 3).

Figure 3. Dimensions of the most commonly-used barbell made for deadlifting

I also decided to design for preventing yield failure rather than fatigue failure because it is a more pressing design concern; it would make more sense to constrain for yielding and optimize for fatigue life rather than the other way around.

The world record deadlift is 500 kg (1,102.3 lbs) by Eddie Hall, so I used a weight of 453.6 kg (1,000 lbs), as events involving more weight than this are so infrequent that yielding in that case would not be of particular concern. This weight is divided into two evenly distributed loads at the ends of the bar, treated as a point load at the center of the distribution, while the opposing forces act where the hands would be placed (I assumed this to be the middle of the knurled portion as seen in Figure 3) [Figure 4].

Figure 4. Lifting of a barbell designed as a beam deflection problem

However, the problem can be simplified to fit a common pattern of loading/support (Figure 5), allowing for a few simple hand calculations to find the stress in the bar. This requires ignoring the weight of the bar itself (which, because of its even distribution and relative lightness, is not crucial anyway) and placing the loads at the very ends of the bar. In the end these assumptions will skew the estimate towards a slightly higher stress, giving an even safer design constraint.

Figure 5. Beam ends overhanging supports & two equal loads applied at symmetrical locations – http://www.engineersedge.com/beam_bending/beam_bending7.htm

Solve

By calculating the bar’s moment of inertia, the distance from the neutral axis, and the section modulus of the cross section of the beam, the maximum bending stress can be found to be 587 MPa (Figure 6).

Figure 6. Simplified representation of a loaded, held barbell and calculation of stress

Therefore, the barbell must be made of a material with a yield strength greater than 587 MPa. A look at a plot of materials’ yield strengths shows that metals, ceramics, and composites are all possibilities (Figure 7).

Figure 7. A plot of different materials’ yield strengths compared to their densities (from the text Materials Engineering, Science, Process and Design by Ashby et. al, 2007)

Metals make the most sense, however, because of their density and ductility. Composites’ light weight means they would be difficult, or impossible, to make into regulation-weighted-and-dimensioned barbells. Ceramics are also very brittle, meaning they break before bending at all; it is usually safer for a product to give warning before breaking, in the form of bending, making a ductile metal a better choice. Given its cost compared to titanium alloys, steel is easily the best choice for a barbell.

There is a dizzying amount of different steel mixtures and grades, but based on searching through tables and information sheets such as this and this, it is a safe bet that molybdenum-alloyed steels (steel alloy 4140/4340, yield strength 655/852 MPa) , cold worked austenitic stainless steels (stainless steel grade 301/304/310, yield strength 470-1310 MPa), and martensitic stainless steels (stainless steel grade 410/420/431, yield strength 415-1895 MPa) are all appropriate choices for a barbell that would not suffer permanent deformation even under the most weight a human has ever (dead)lifted.


Products recalled for children’s

Identify

Many furniture was designed harmful for children, many children were injured or killed due to tip over of the furniture. Dressers designed like this (fig. 1) has killed 7 children and got many injured. In 2016, IKEA recalled many dressers that have potential to tip over while kids climbing it. For a 8-year-old child, is it possible to tip the dresser over when climbing? Unknown: sum of the moment at the center of tip-over.


(fig. 1: dresser tip over due to defect)

(fig 2: information of one of the dressers IKEA recalled in 2016)

Formulate

Goal: find the moment at point O.

Formula to use: M = F*d(perpendicular)

The dresser is 134 cm tall, and 48 cm deep. Width is not necessary to measure since we are using a 2-d model.

First, we set up a 2D model to solve the problem (fig. 3).

O: point of tip-over. A: center of mass of the child. B: center of mass of the 3 drawers inserted. C: center of mass of the dresser (without drawers). D: center of mass of the top drawer that is out.

Drawers are 9.25 kg each. Dresser without drawer is 35.97 kg. Mass of a 8-years-old child: 23 kg. A(-55, 75), B(24,50), C(24,67), D(-24, 100)

Assumptions: the dresser is uniformed in weight. weight of the foots and top are negligible. No other things in the drawer. The top drawer is fully out and other drawers are fully inside. Center of mass occur at the geometric center of the main body.

(fig. 3 2-D model for the problem.)

Solve

ΣM= 28 kg* 9.8N/kg* -0.55m+3*9.25kg* 9.8N/kg* 0.24m+35.95kg* 9.8N/kg* 0.24m+9.25kg* 9.8N/kg* -0.24m = -150.92+65.27+84.56-21.76=-22.85N-m

The answer implies that a 8-year-old child is able to tip the dresser over by climbing on the top of the drawer. We assumed that the dresser is empty, and uniformed in weight. However, in real-life the problem could be more specific. Also we simplified the problem as a 2-D problem which implies that the dresser would only tip to the left, but in 3-D world the it could tip at any angle. Further, only one case which the child hangs one the top drawer with other drawers inserted was analyzed, but many other situation could happen in real-life.

The answer is reasonable since all values used were real-life values, and that is why the products were recalled.

In this case, any child weighs over 26 kg has potential to tip over the dresser and get injured or killed.

links:

http://abc7chicago.com/family/safety-group-highlights-recalls-of-childrens-products/1833068/

https://www.disabled-world.com/artman/publish/height-weight-teens.shtml

http://www.ikea.com/gb/en/products/storage-furniture/chest-of-drawers/brusali-chest-of-4-drawers-white-art-20252742/

http://www.ikea.com/ms/en_CA/pdf/Recalled_Chest_of_Drawers_Jun29_EN.pdf?icid=itl|ca|en_secureit_pdf|201606282141595720_1

Increasing the Accuracy of Wearable Heart Rate Monitors

Identify: Many people today look for ways to track their workouts to make sure that they are getting the best possible results whether it is for weight loss or training performance purposes. From high intensity interval training to slow jogging, heart rate monitors have proven to be popular in assisting users with how well they are performing. Furthermore, there are different types of heart heart monitors that are on the market today including chest straps and wearables that have proven to be successful. However, each different type of heart rate monitor has a slightly different method of measurement. So, lets take a peek into how these devices work.

Chest straps are one of the most popular and well known forms of a heart rate monitor that is used today. These straps use a wireless sensor to detect your pulse electronically and then send that data to a wristwatch-style receiver to display. Although these are deemed to be the most accurate, they are not the most comfortable to wear during a workout. Therefore, wearable wrist heart rate monitors have been developed which use an optical sensor built into the wrist unit’s watchband or case back to detect your pulse in a more comfortable way during your workout. The downside to these devices is that they are less accurate than a chest strap. Therefore, we can take a look into how to design an optical sensor that has the most accuracy possible for wearable HRM (heart rate monitor) devices.

Formulate: The main issues that have caused a lower accuracy and unclear signal in wearable HRMs have been the noise, weakness of the measured signal, amplitude of motion, and wide variance between different peoples’ wrists. To look into resolving these issues, it needs to be understood how these devices work. Optical HRM sensing is based on the principle of photoplethysmography (PPG). This allows the wristband to relate the pressure pulse from blood vessels as blood is passing through to each time a heart beats to get the heart rate. The way it does this is by using an LED to emit light into the body’s tissues and and use photodiodes to measure the amount of light that passes through them. The difficulty with this technology is that the measured signal is very small. In order to make a more accurate heart rate monitor, we want to be able to record the signal with the least amount of noise around it due to motion.

The most effective way for reducing the noise is simply the position of the wearable HRM in reference to the skin. The band needs to be worn with a snug fit and maintain an unchanged position throughout a workout. In the figure below, you can see the different interference levels depending on the gap between the skin. On the left, there is more interference shown by more blue lines and on the right there is less interference due to the proximity that the sensor is to the skin.

It is also important to understand that there are other factors that can cause interfere with a wearable HRM to decrease accuracy. For example, wrist curvature, wrist hair density and color, and skin color can all affect an optical signal’s reading. Skin color is a factor of great interest due to the fact that it greatly affects the signal and requires a change in LED brightness. Between the physical gap and skin tone, both factors are large determinants of accuracy for a wearable HRM.

Solve:

In order to design an optical sensor. We will want to minimize the gap between the sensor and sin but also include a sensor that can accurately read a signal with various skin tones.

We can use this equation for photocurrent by breaking it into AC and DC components of the signal. Typically, there might also be ambient light present (AC + DC noise). However, “the DC component of optical noise is usually subtracted due to an ambient light measurement immediately prior or after the LED light on measurement, resulting in an effective signal of”:

Further Readings

Best Heart Rate Monitors and HRM Watches

Heart Rate Monitors: How to Choose and Use

How to design an optical heart rate sensor into a wearable devices wristband

LED – Based Sensors for Wearable Fitness Tracking Products

SFH 7050 – Photoplethysmography Sensor

Using Inverse Dynamics to Prevent Ankle Injuries

Identify:

Ankle injuries are one of the most common injuries that occur in NFL linemen. If these injuries persist, the number of games missed can accumulate and the injuries can potentially end a player’s career. Research is currently being done to figure out how these injuries occur in order to design more efficient equipment such as ankle braces and modified cleats. One common method of injury involves the linemen planting the tip of their foot on the ground with great force. The force that is applied translates over to the ankle which causes the injury. Can we use engineering principles to approximate how much force is applied to the ankle? Yes we can, with the use of inverse dynamics. Inverse dynamics calculates forces and moments at one body segment by using the forces and moments of an adjacent body segment as well as the position, velocity, and acceleration of the connected body segments. By using inverse dynamics, one can solve for the amount of force that is applied to the ankles and potentially create new technology, such as insoles for the cleats, which can absorb some of the force that is applied and thus reduce the risk of injury.

Formulate:

Known Values and Assumptions:

Height = 1.956 m (6 foot 5 inches)* → length of foot (d) = (1.956)(0.0425)** = 0.08313 m

Mass = 141.521 kg (312 pounds)* → mass of foot (m) = (141.521)(0.0143)** = 2.024 kg

Force due to gravity (Fg) = m(9.81) = (2.024)(9.81) = 19.855 m/s^2

Normal force (FN) and force of friction (FFr)***, which are applied at the tip of the foot.

Angle between foot and playing surface (θ) = 15°[1]

Linear acceleration (a) and angular acceleration (α)****

Moment of Inertia (I)

Center of mass = (0.50)(d) = 0.0416 m

*Average height and weight of an NFL lineman during the 2015 season[2]

**Body segment weight and length[3]

***Exact value of FN and FFr can be used if force plate data is available

****Exact value of a and α can be used if motion capture data is available

Unknown Values to be Solved For:

x-direction force applied to the ankle (Fx, ankle)

y-direction force applied to the ankle (Fy, ankle)

Moment about the ankle (Mankle)

Equations to be Used:

∑Fx = max

∑Fy = may

∑M = Iα

Figure 1: Free-Body Diagram of the forces acting on the foot and ankle of an NFL lineman

Solve:

Step 1: calculate moment of inertia

Radius of gyration constant for the foot (Kfoot)[4] = 0.475 m

Radius of gyration of the foot (kfoot)= (Kfoot)(d)[4] = (0.475)(0.08313) = 0.0395 m^2

I = (m)(kfoot) = (2.024)(0.0395) → I = 0.0799 kg*m^2

Step 2: solve for forces in the x and y direction

∑Fx = ma→ (2.024)(a*cos(15)) = Fx, ankle – FFrFx, ankle = FFr+ 1.955*a

∑Fy = may → (2.024)(a*sin(15)) = FN – 19.855 – Fy, ankleFy, ankle = F– 19.855 – 0.524*a

Step 3: solve for moments

∑M = Iα → (I)(α) = Mankle + (dy)*(Fx, ankle – FFr) + (dx)*(F– Fy, ankle)

where:

d= y-distance between ankle or tip of foot to center of mass

d= x-distance between ankle or tip of foot to center of mass

∑M = Iα → (0.0799)(α) = Mankle + (0.0416*sin(15))*(Fx, ankle – FFr) + (0.0416*cos(15))*(F– Fy, ankle)

∑M = Iα → Mankle =(0.0799)(α) – (0.011)*(Fx, ankle – FFr) + (0.040)*(F– Fy, ankle)

The solution seems reasonable in the sense that forces are being added on to the ankle. The extent to which the forces are added will depend on multiple factors such as the angle between the cleats and playing surface as well as the height and weight of the athlete being tested. One limitation in this solution was not using exact values of angular and linear acceleration as well as the normal and frictional force. If one is able to accurately obtain these measurements via motion capture and force plate data, they can plug the values into the solutions above to determine exact values of the forces and moments acting on the ankle. For future studies it may be interesting to look at how the other lower limbs, such as the knees and hips, react to translated forces which can accumulate and potentially lead to a greater risk of non-contact injury.

Sources:

[1]: https://www.google.com/patents/US3413737

[2]: http://www.businessinsider.com/nfl-offensive-lineman-are-big-2011-10

[3]: http://www.exrx.net/Kinesiology/Segments.html

[4]: http://health.uottawa.ca/biomech/courses/apa2313/bsptable.pdf

Exercise and Save Money: Turning Exercise Work to Electricity

IDENTIFY:


Cycling is a type of popular cardio exercise that can be widely seen in gym, home, and outdoor. This exercise allows exerciser to expend energy by rotating feet around the center of flywheel. Generally, the work done by exerciser just transfer to heat and lost in the air, but can we store the energy and utilize it for our daily life? The answer is yes. In article These Exercise Machines Turn Your Sweat Into Electricity fromIEEE spectrum, it states that Harr, a 21 year old mechanical engineering graduates of University of Florida developed that energy conservation device [1]. By converting workout energy to electricity, electrical bill can be reduced. At the same time, it encourages people to do more exercise to achieve a healthier life. In order to make a real cycling machine to meet this demand, engineers need to identify, formulate, and solve problems. For example, a question would be how long the crank arm of  the cycling machine should be in order to generate 6000 Joules energy in a hour (100watts) ? This question need to be solved because it makes more sense if the machine can generate noticeable amount of energy. The unknown is the crank arm length, and variables are rotating speed of exerciser and exercise duration, which can be assumed as 0.5 m/s and 1 hour, and the work expected is 6000 joules. By solving this problem, engineers would be able to design the machine with proper crank arm length.

Figure 1[2]This picture express someone is recycling workout energy to lighten bulbs.


FORMULATE:

Figure 2. This hand drawing express the flywheel and crankarm park on a normal bike.

Assumptions and Simplification:

(1) The weight of the exerciser’s feet is 1kg (Assume 70kg*1.45%*2)[3]

(2) exerciser’s feet are rotating in a constant speed of  0.5 m/s

(3) The generated energy expected in 1 hour is 6000J (100 watts)


The problem is to solve the length of the crank arm of this cycling machine (the radius of this circular motion).


Equations for circular motion and work: 

SOLVE:

Since we expect work done is 6000 Joules in a hour, and distance is 0.5 m/s *  3600 s = 1800m,

F = W/d = 3.3 N

F = 3.3 N = (mv^2)/r = (1kg*1m^2)/r

=> r= 1kg*m^2/3.3 N = 0.3 m

Thus, as assumptions made above, the radius of the crank arm of the cycling machine should be about 30 cm, which is realistic.

The variables like feet weight (directly related to force applied on pedal), and rotating velocity can be various for different user. Thus the energy generate can be different for different user too. Generally, more force input the exerciser do, the more the energy generated, and faster the exerciser rotate their feet, the more the energy generated.

One major limitation need to be concerned for this design is that the energy generated won’t be 100% converted to electricity. Thus there is more problems need to be solve to make the conversion more efficient.

Overall, the length of the crank arm of the cycling machine should be about 30 cm in order to generate 6000 joules per hour (100 watts). The solved length is a reasonable value. The energy generated for a single cycling machine might not be a lot, but it can be a more significant number if the system is utilize by gym on multiple cycling machines.

Path forward: instead of a in home exercise device, it can be further designed as a portable energy conservation system attached to a real bike that cycling work can be conserved into battery. In addition, not only cycling machine, the energy recycling system can be applied on other type exercise machines with similar mechanism.

More to read:

Could We Use Exercise Machines As Energy Sources? 

In the Gym: Clean Energy From Muscle Power

These Exercise Machines Turn Your Sweat Into Electricity