
Some instructors have contacted our team recently about the Grades tool in Canvas, expressing some concerns over its features and calculation process. In order to clarify the process and share some tips, we are posting this three-part series on the Canvas gradebook.
The Total column doesn’t seem right…
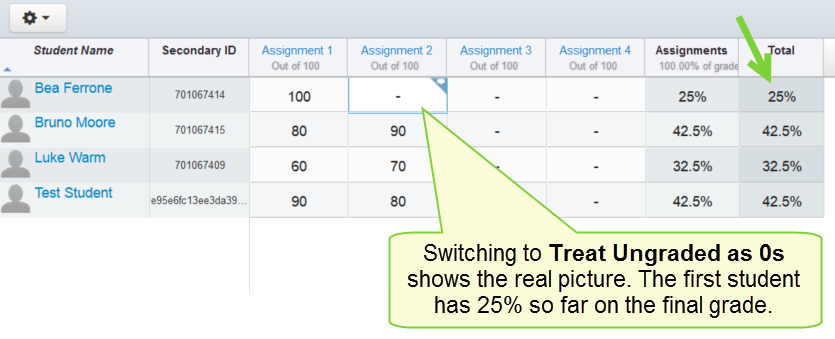
Consider the following scenario: A course has four assignments, each one graded on 100 points and worth 25% of the final grade. After having graded the first assignment, the Grades tool looks like this:
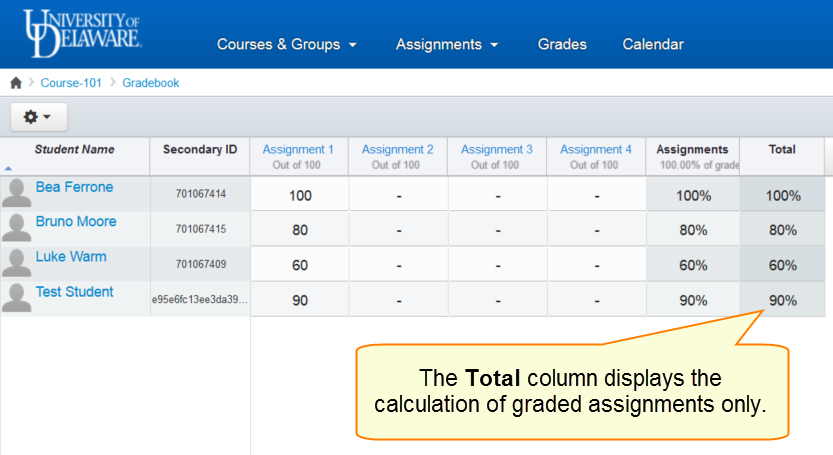
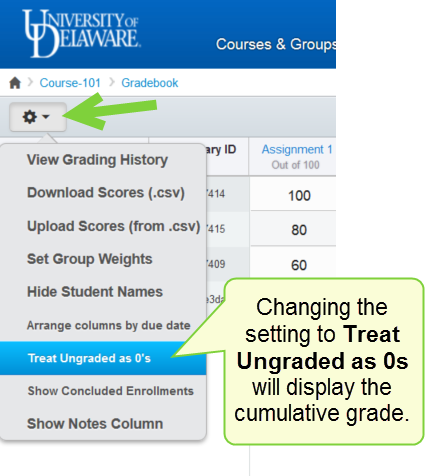
By default, the Grades tool only displays the total for graded assignments, which can be misleading. You can change how the Total column calculates the grade by going to the gear icon and choosing Treat Ungraded as 0s.
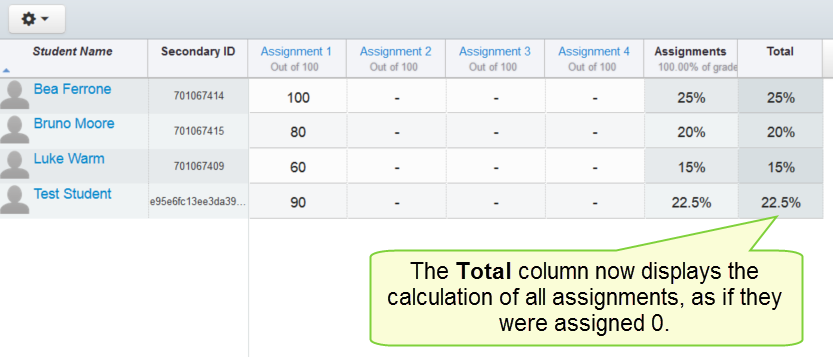
Choosing this option will reset the Total column to include all the assignments in the calculation, not only the ones that are already graded. In this scenario, the first student’s Total dropped from 100% to 25%.
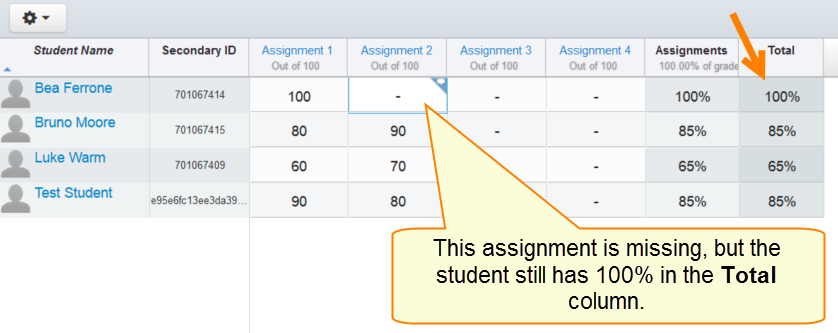
Be careful when analyzing your students’ grades because if you leave the setting at the default view, you might be missing students who have not turned in an assignment. Look at the first student’s total in the following screenshot, for instance. Even though she’s the only student who has not turned in assignment 2, she still has the highest grade according to the Total column.
Changing the setting to Treat Ungraded as 0s again gives a clearer picture of what’s happening. The other students have made more progress in completing the course.
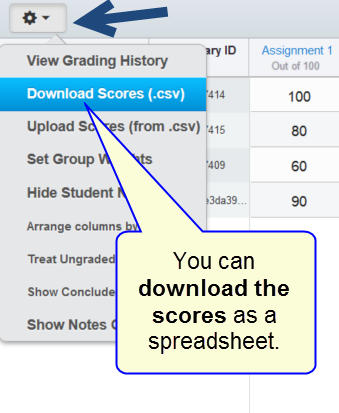
In the same gear icon menu, you can download all the grades to your computer as a .csv file.
You will notice that the .cvs file, when opened in Excel, will show two score columns. The first one (Current Score) is the same as the default view. The second one (Final Score) is the same as the Treat Ungraded as 0s score.
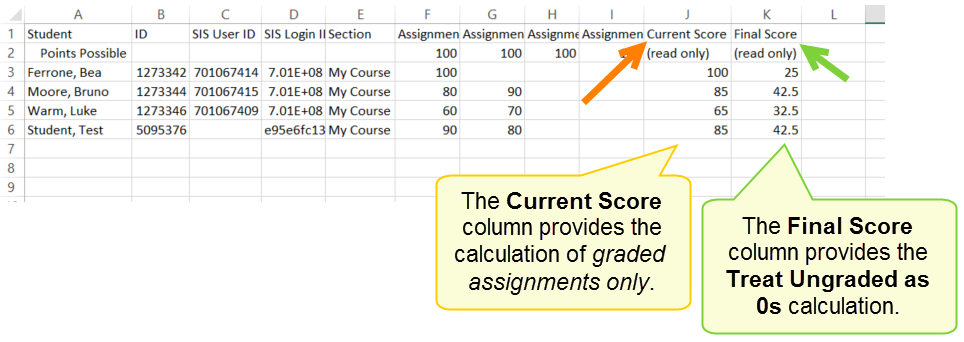
Before turning in your grades to UDSIS, double-check to make sure you are submitting the grade that fits your grading scheme.
In part 2, we will explain how to enable the calculation of letter grades in Canvas.